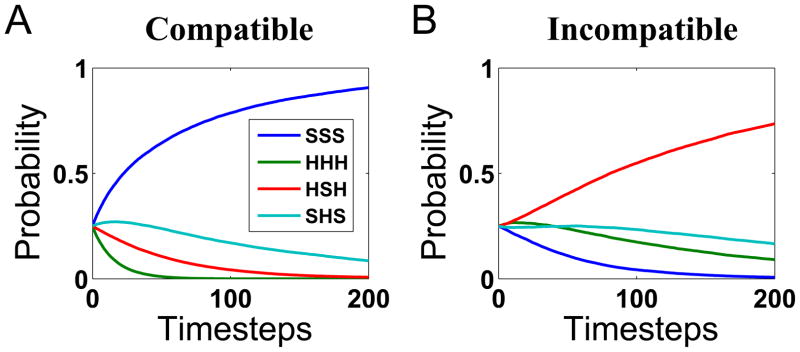
Figure 6.
Mean trajectories of posterior probabilities for the spatial uncertainty model. (A) Given the stimulus array HHH (s2 = H, M =C), the posterior probability for HHH rises toward 1 over time, as the posterior probability for all the alternative explanations fall toward 0. (B) Given the stimulus array SHS (s2 = H, M =I), the posterior probability for SHS beats out the rest with time. However, the rise is less steep, and the combined influence of the second and third mostly likely candidates (SSS and HSH, the latter due to the spatial “smearing” in the inputs) at the start of the trial are sufficient to result in the posterior probability for s2 = H to dip below .5 in Figure 5.

