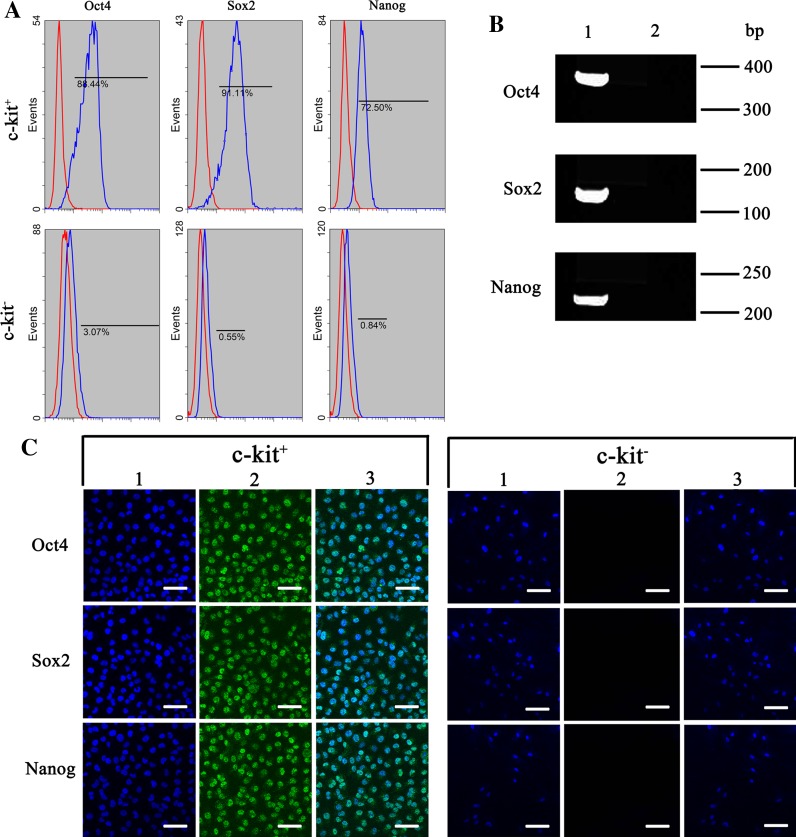
Fig. 4.
Pluripotency markers Oct4, Sox2 and Nanog expression in c-kit+ and c-kit− AFS cells. a Flow cytometry analysis. b RT-PCR analysis. Line 1 c-kit+ AFS cells; Line 2 c-kit− AFS cells. Data shown are representative of three independent experiments. c Immunocytochemical analysis. 1 Nuclear stain with DAPI (blue); 2 Antibody staining of Oct4, Sox2 and Nanog protein levels (green); 3 Fusion of 1 and 2. All scale bars represent 100 μm. (Color figure online)

