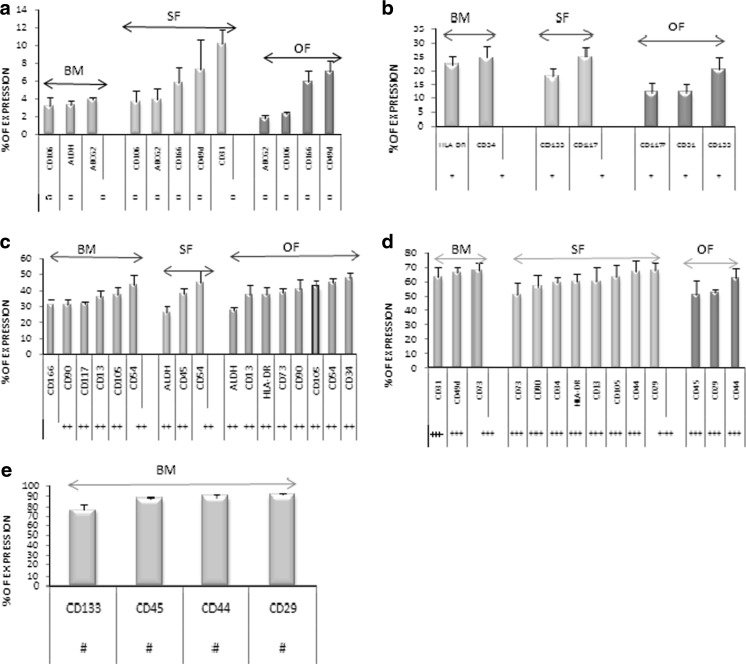
Fig. 4.
Ranges of Expression of cell surface markers among BM, SF and OF. The expression profiles of cell surface markers are categorized based on their range of expression using Mean ± SEM values. The categorization of expressions is as follows: The sparse expression of the cell surface markers (a); low expression of the cell surface markers (b); moderate expression of the cell surface markers (c); high expression of the cell surface markers (d); remarkable expression of the cell surface markers (e)

