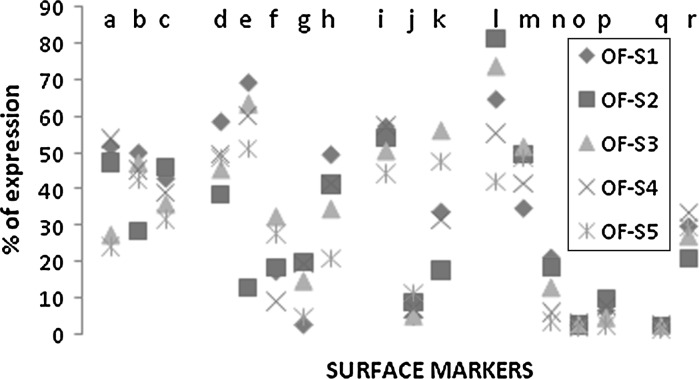
Fig. 8.
Cell surface marker profile (n = 18) of samples within Omentum Fat. This figure represents a systematic comparison of expression profile variation among 5 samples of omentum fat. The details of cell surface markers denoted by a–r are mentioned below: (a CD90; b CD105; c CD73; d CD34; e CD45; f CD133; g CD177; h HLADR; i CD29; j CD49d; k CD13; l CD54; m CD31; n CD44; o CD106; p CD166; q ABCG2; r ALDH)

