
Figure 2.
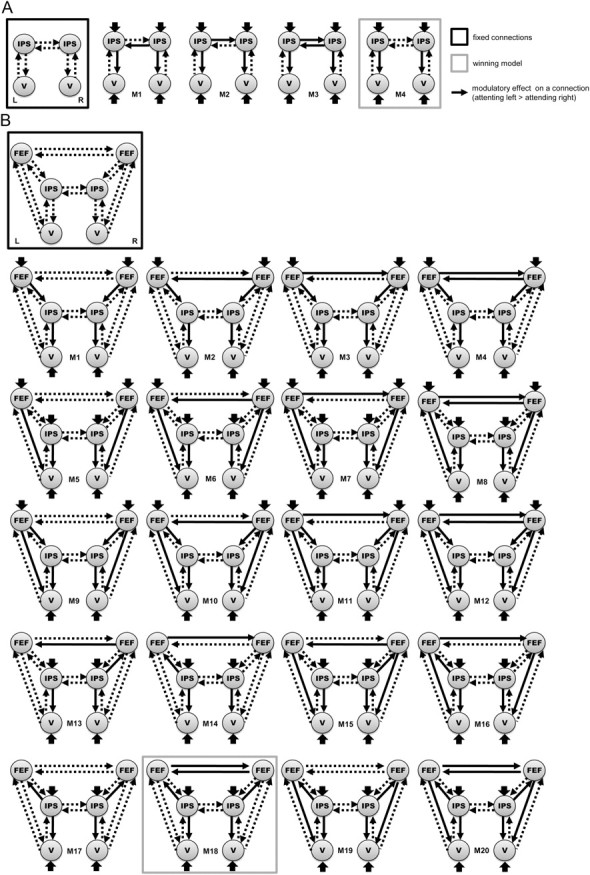
Model space for Bayesian model comparison of dorsal network DCMs. A, Models including IPS and visual cortex. B, Models including FEF, IPS, and visual cortex. Fixed connections are indicated by dashed arrows and are identical across competing models. Solid arrows represent the model-specific modulatory (bilinear) effects on connections. L, Left; R, right.