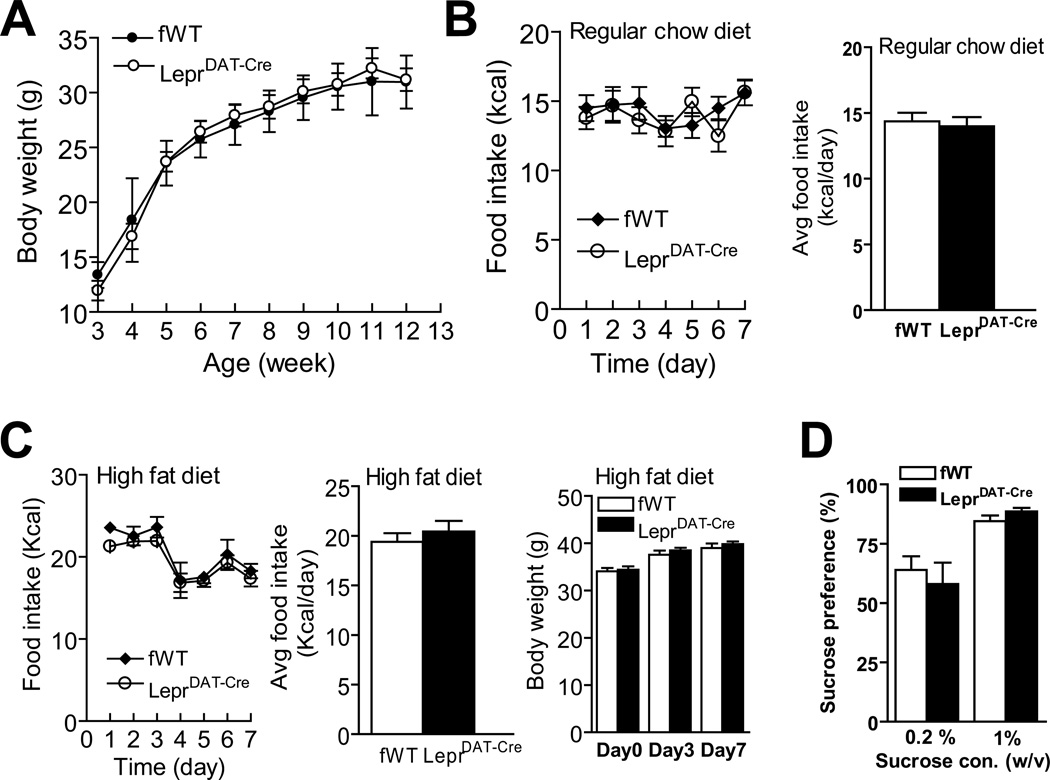
Figure 2.
Normal body weight gain, food intake and hedonic responses in LeprDAT-Cre mice. (A) Body weight. (B) Intake of regular chow diet. Left panel: Daily food intake. Right panel: Average food intake over 7 days. n = 9–10 per group. (C) Intake of high fat diet. Left panel: Daily food intake. Middle panel: Average food intake over 7 days. Right panel: Body weight. n = 8–9 per group. (D) Sucrose preference. The preference for sucrose was expressed as a percentage of the volume of sucrose solution intake to the volume of total fluid intake within a 4-day test. n = 8–9 per group. All data are presented as mean ± SEM.

