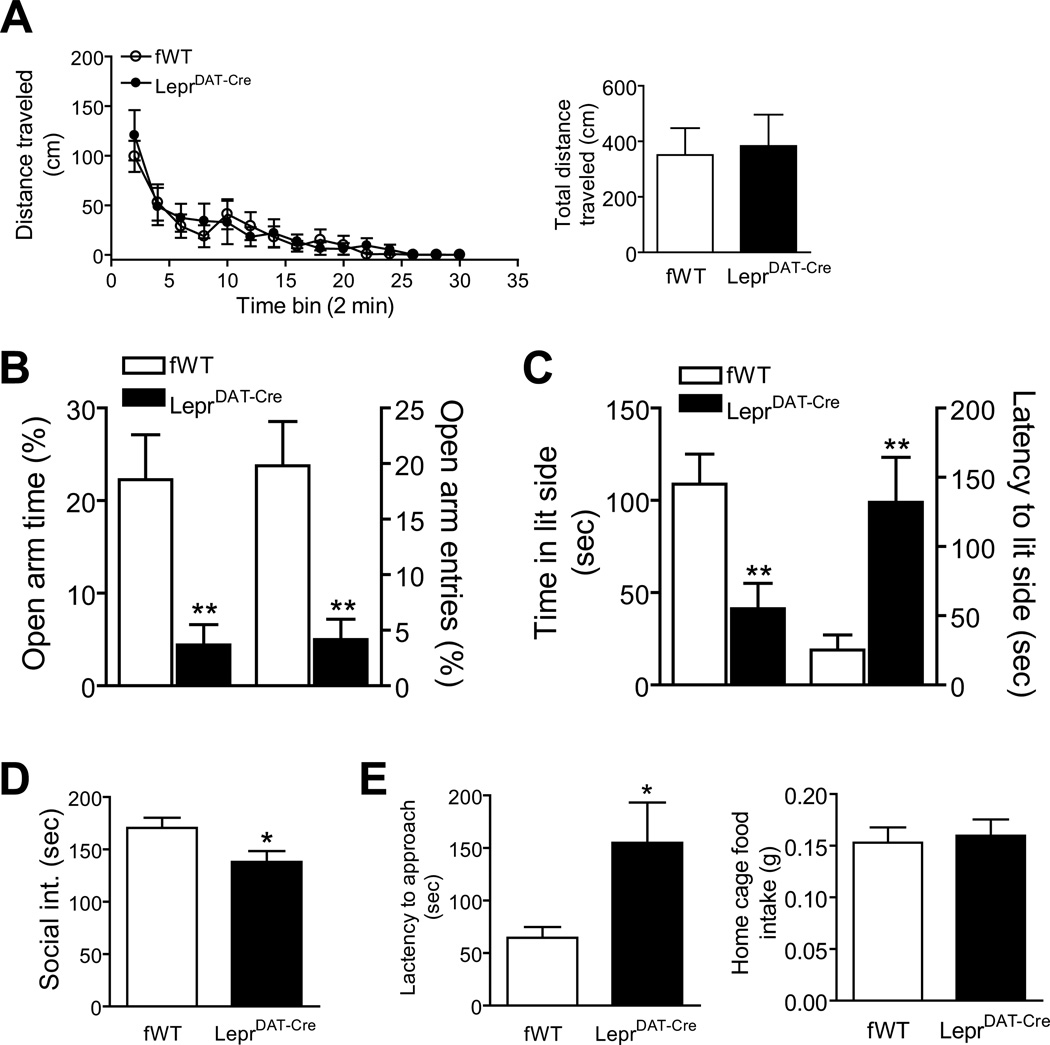
Figure 3.
Anxiogenic-like behavioral phenotype of LeprDAT-Cre mice. (A) Locomotor activity. Left panel: locomotor activity monitored for 30 min and analyzed at 2 min intervals. Right panel: Total distance traveled within 30 min. n = 10 per group. (B) Elevated plus-maze test. Left axis, the percentage of open arm time. Right axis, the percentage of open arm entries. n = 10 per group. (C) Light/dark choice test. Left axis, latency to enter the light side. Right axis, time spent in the light compartment. n = 12 per group. (D) Social interaction test. n = 9–12 pairs per group. (E) Novelty-suppressed feeding test. Left panel, latency to approach food pallets in the center of an open arena. Right panel, home cage food intake for 5 min immediately following the test. n = 12 per group. All data are expressed as mean ± SEM. *p < 0.05; **p < 0.01 compared with Leprflox/flox littermate control (fWT) mice by two-tailed Student’s t test.

