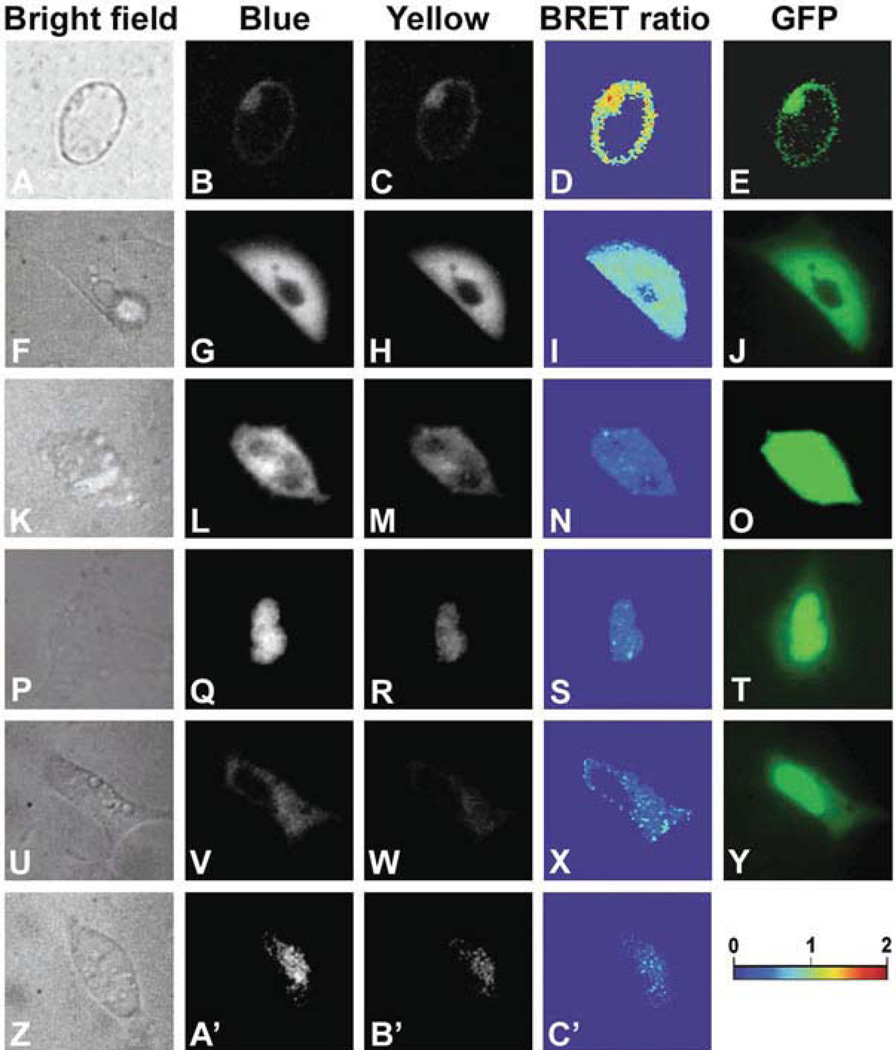
Fig. 1.1. Subcellular imaging of BRET in single plant and animal cells.
Arabidopsis suspension culture, HEK293, and mouse GHFT1 cells. a–e Isolated Arabidopsis cell from a suspension culture line that is expressing RLUC-EYFP. f–j HEK293 cells expressing hRLUC-Venus; Y ÷ B = 0.82 ± 0.07 SD over the luminescent portion of the cell. k–o HEK293 cell expressing unfused hRLUC and Venus; Y ÷ B = 0.36 over the luminescent portion of this cell. p–t Mouse GHFT1 cells expressing hRLUC-C/EBPα + Venus-C/EBPα; Y ÷ B = 0.39 ± 0.04 SD over the luminescent portion of the cell. u–y Mouse GHF1 cells expressing hRLUC + Venus-C/EBPα; Y ÷ B = 0.30 over the luminescent portion of this cell. z–c' Mouse GHF1 cells expressing hRLUC-C/EBPα; Y ÷ B = 0.24 ± 0.06 SD over the luminescent portion of the cell. Panels a, f, k, p, u, z are bright field, panels b, g, l, q, v, a' are Blue-range luminescence, panels c, h, m, r, w, b' are Yellow-range luminescence, panels d, i, n, s, x, c' are BRET ratios (Y ÷ B) over the entire images (pseudocolor scale shown below panel y), and panels e, j, o, t, y are fluorescence from EYFP or Venus in the fusion proteins. (Modified from Xu etal. (16).)

