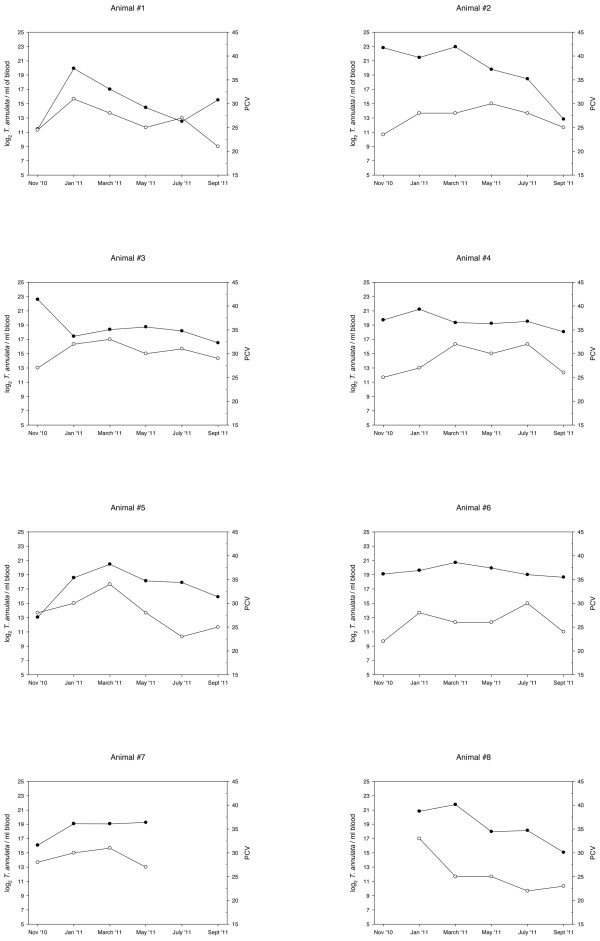
Figure 2.
Graphical representation of individual parasitaemia (log2 T. annulata /ml of blood) variations (black dots) throughout the study along with the corresponding PCV results (open dots) for each animal. Age of animals (in months) at first sampling was as follows: Animal #1, 92; Animal #2, 49; Animal #3, 79; Animal #4, 37; Animal #5, 47; Animal #6, 46; Animal #7, 121; Animal #8, 26.

