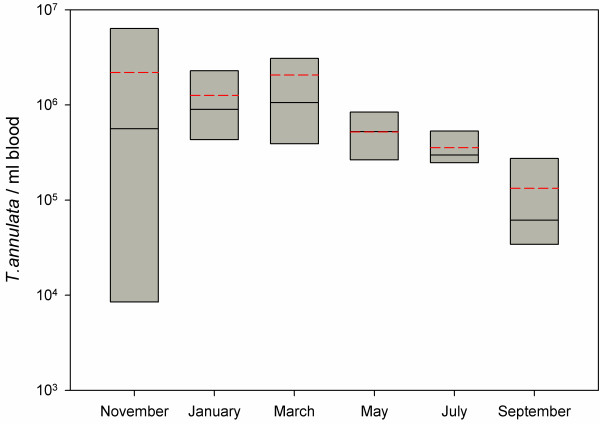
Figure 3.
Box Plot representing T. annulata per ml of blood in the animals grouped according to the sampling time. The boundary of the box closest to zero indicates the 25th percentile, the continuous line within the box marks the median, the dashed line marks the mean and the boundary of the box farthest from zero indicates the 75th percentile.

