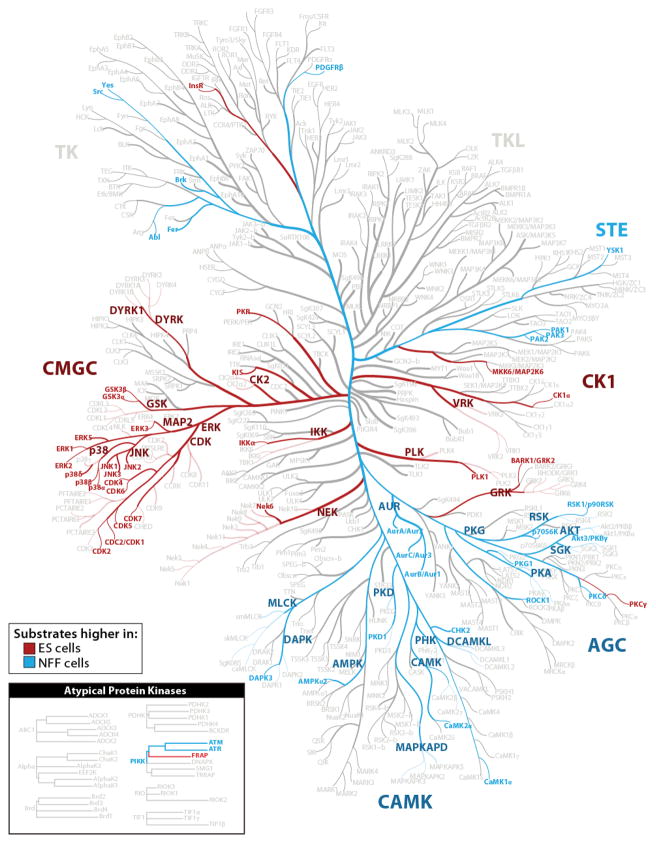
Figure 3. Kinase substrate analysis.
Adapted from Manning et al.24. We predicted potential kinases for every phosphorylation site using the Group-based Prediction system. We applied Fisher’s exact test (followed by Benjamini-Hochberg adjustment) to test for enrichment of kinase substrates in sets of phosphorylation sites that were changing by more than two-fold between ES and NFF cells kinase substrates enriched in ES cells are highlighted in red (P < 0.05). Kinase substrates enriched in ES cells are highlighted in blue (P < 0.05).

