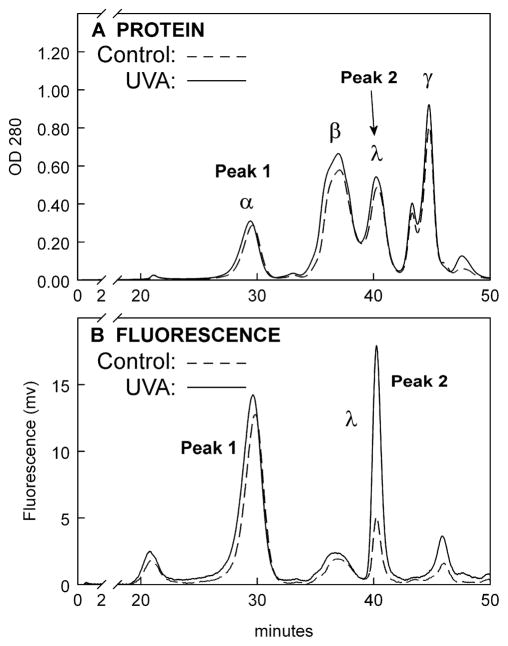
Figure 9.
HPLC profiles of rabbit lens cortical proteins and fluorescence following a 1 hr in vivo exposure of the eye to UVA light (365 nm, 100 mW/cm2). A BioSep-SEC-s4000 column was employed. A. Protein (OD 280nm), B. Fluorescence, excitation: 365nm, emission: 570nm. Representative of 3 experiments. Note: The area under the experimental λ-crystallin fluorescence peak is 4.4 +/− 0.9 × greater than that for the control (p<0.01).

