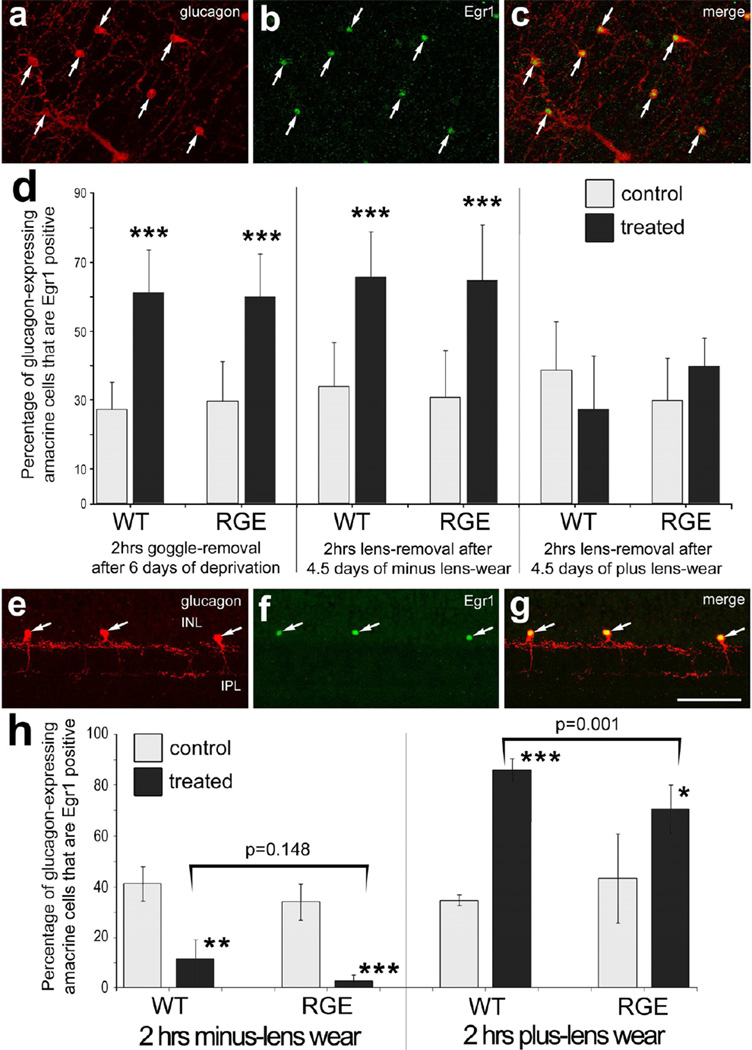
Figure 4.
The expression of Egr1 is differentially regulated by defocus in glucagonergic amacrine cells in both WT and RGE retinas. Whole-mount preparations (a-c) and vertical sections (e-g) of the retina were labeled with antibodies to Egr1 (green) and glucagon (red) (a-c and e-g). Arrows indicate amacrine cells double-labeled for Egr1 and glucagon. Representative images of immunolabeled retinas were obtained from RGE eyes that were treated with 2 hrs of visual recovery following 6 days of form-deprivation (a-c) or from RGE eyes that were treated with 2 hrs of plus lens-wear (e-g). The calibration bar (50 µm) in panel g applies to panels a-c and e-g. Histograms in panels d and h illustrate the mean and standard deviation for the percentage of glucagonergic amacrine cells that are Egr1-positive in WT and RGE retinas. Panel d; WT and RGE eyes were treated with 6 days of FD followed by 2 hrs of unobstructed vision, 4.5 days of minus lens-wear followed by 2 hrs of unobstructed vision, 4.5 days of plus lens-wear followed by 2 hrs of unobstructed vision, 2 hrs of minus lens-wear, or 2 hrs of plus lens-wear. Panel h; WT and RGE eyes were treated 2 hrs of minus lens-wear or 2hrs of plus lens-wear. Significance of difference (*p<0.05; **p<0.002; ***p<0.0001) between control and treated eyes within a treatment group was determined by using a paired two-tailed Student’s t-test. Significance of difference between treatment groups (lens-treated RGE vs lens-treated WT) was determined by using a one-way ANOVA (p<0.001) and a post-hoc Bonferroni analysis (brackets and p-values). Asterisks indicate significant differences within a treatment group (control vs treated), and brackets and p-values indicate significant differences between treatment groups (WT vs RGE).

