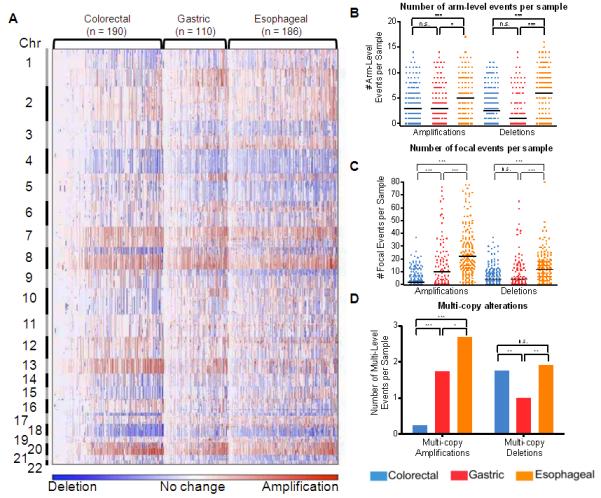
Figure 1. Patterns of chromosomal instability differ across adenocarcinomas of the gastrointestinal tract.

a) Amplifications (red) and deletions (blue) are displayed for 486 gut adenocarcinomas (x-axis) across the genome (y-axis). Quantitation of b) arm-level and c) focal SCNAs. Solid bars represent median numbers of events per sample. Error bars represent S.E.M. d) Quantitation of inferred multi-copy SCNAs (high-level amplifications with inferred copy >4 and presumable homozygous deletions, inferred copy-number <1.3). ***, P < 0.0005; **, P < 0.005; *, P < 0.05; n.s., not significant.
