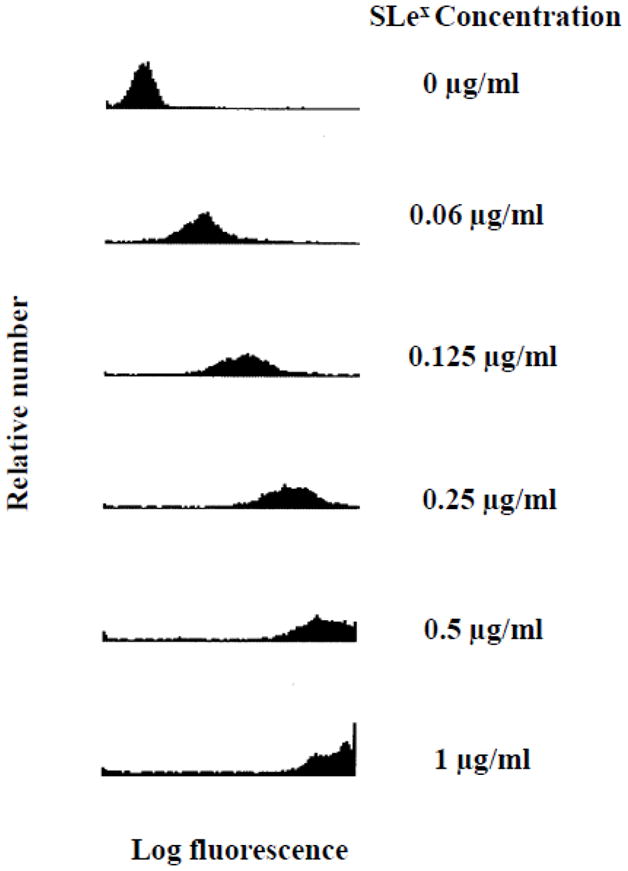
Figure 1.

Analysis of sLex microspheres by flow cytometry. The sLex microspheres were first treated with HECA-452 and then a FITC labeled goat anti-rat IgM antibody. The histograms represent the fluorescence distribution of the population of microspheres analyzed. The log fluorescence correlates with the levels of HECA-452 epitopes bound to the sLex microspheres. The coating concentrations used to prepare the sLex microspheres are shown on the right side. The data presented represent n≥3 experiments.
