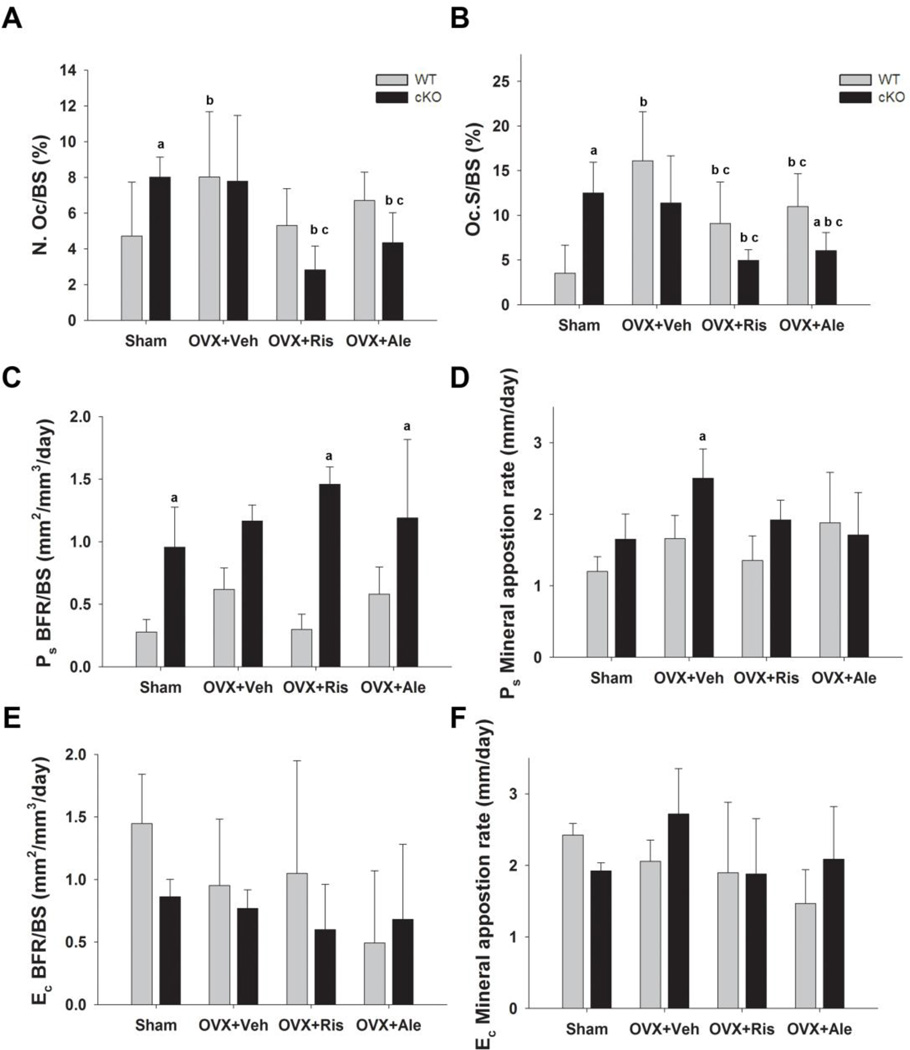
Figure 5. Effect of OVX and bisphosphonate treatment on cortical bone turnover in wild type (WT) and Gja1 conditional knockout (cKO) mice.
(A) Osteoclast number and (B) osteoclast surface as percentage of endocortical surface area, assessed by TRAPC+ staining of femur section in the different genotypes and treated groups (See Fig. 2 for abbreviations). (C) Periosteal bone formation rate (BFR); (D) periosteal mineral appostion rate (MAR); (E) endosteal BFR; and (F) endosteal MAR in the different genotypes and treated groups at the end of the study (n=4). a, p< 0.05 vs WT, b, p< 0.05 vs Sham; c, p<0.05 vs OVX+Veh, 2-way ANOVA, and post-hoc multiple t-test (Holm-Sidak).

