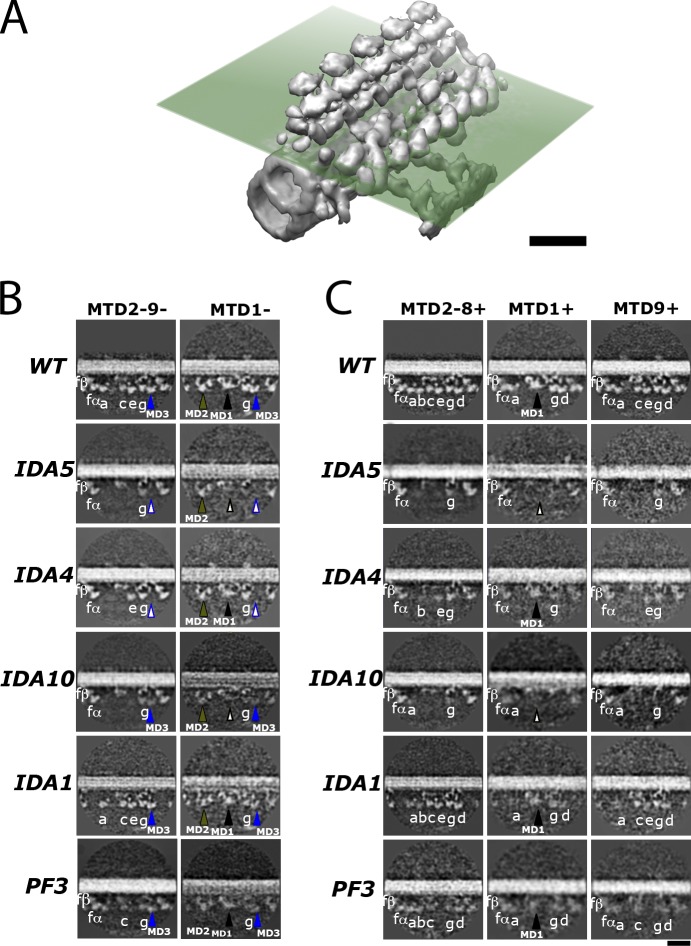
Figure 5.
Sections showing the dyneins in wild-type and mutant axonemes. (A–C) Illustration of the cross-section plane (transparent dissecting plane; A) in B and C in relation to the isosurface structure. Cross-sections of density maps of wild type (WT) and mutants in the proximal (B) and distal (C) regions in wild type, ida5, ida4, ida10, ida1, and pf3 are shown. The color of each arrowhead is the same as in Fig. 4. Bars, 32 nm.

