Figure 6.
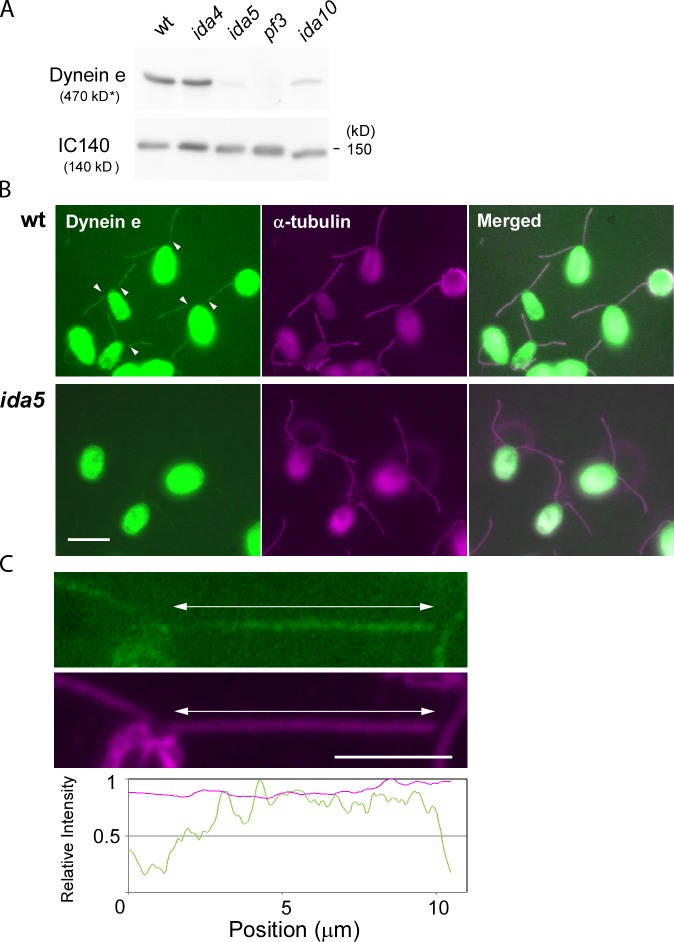
Immunofluorescence localization of inner-arm dynein e. (A) Immunoblot analysis of wild-type (wt), ida4, ida5, ida10, and pf3 axonemes using antibodies against dynein e heavy chains and IC140 (positive control). The molecular mass of dynein e is the expected value, as dynein e migrates significantly more slowly than the 250-kD molecular mass marker, which is not shown. The reduction of dynein e in ida10 is consistent with the previous result (Yamamoto et al., 2010). (B) Indirect immunofluorescence observation of inner-arm dynein e (left; green signal) and α-tubulin (middle; purple signal) in wild-type and ida5 cells. The right images show the merged images. Note that almost no dynein e signal was detected in ida5 axonemes. The dynein e signals in the proximal region of wild-type axonemes are significantly reduced compared with the distal regions. The boundaries are indicated with white arrowheads. Bar, 10 µm. (C) Magnified images of part of a wild-type cell and the densitometric evaluation of the signal intensities of dynein e and acetylated tubulin along the flagellum. The nucleoflagellar apparatus (see Materials and methods) was analyzed. The entire length of flagella is shown by double-headed arrows. Bar, 5 µm.

