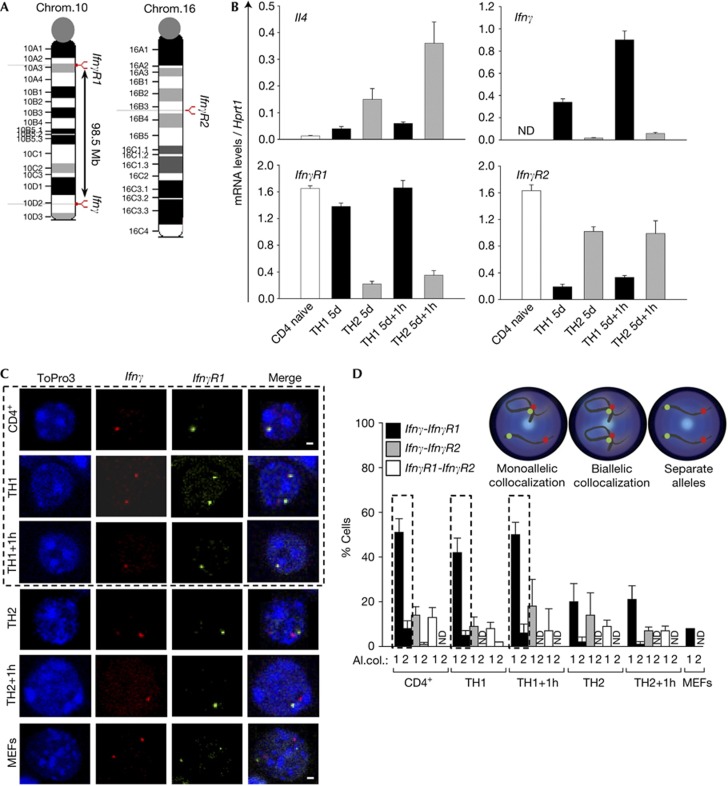
Figure 1.
Monoallelic intrachromosomal colocalization of the Ifnγ-IfnγR1 gene loci. (A) Schematic representation of the Ifnγ and IfnγR1 gene loci. (B) Quantitative RT–PCR analysis for the mouse Il4, Ifnγ, IfnγR1 and IfnγR2 genes. Results are the mean±s.e.m. from triplicate samples of four independent experiments. (C) Single optical sections from confocal analysis of DNA-FISH. (D) Quantitative analysis of the DNA-FISH experiments presented in (C) and supplementary Fig S3A,B online. Al.col., allelic colocalization (1=a cell with one allele of each locus colocalized, 2=a cell with both alleles of one locus colocalized with both alleles of the other locus). DNA-FISH, DNA fluorescence in situ hybridization; MEFs, mouse embryonic fibroblasts; mRNA, messenger RNA; ND, not detected; RT–PCR, reverse transcriptase PCR.

