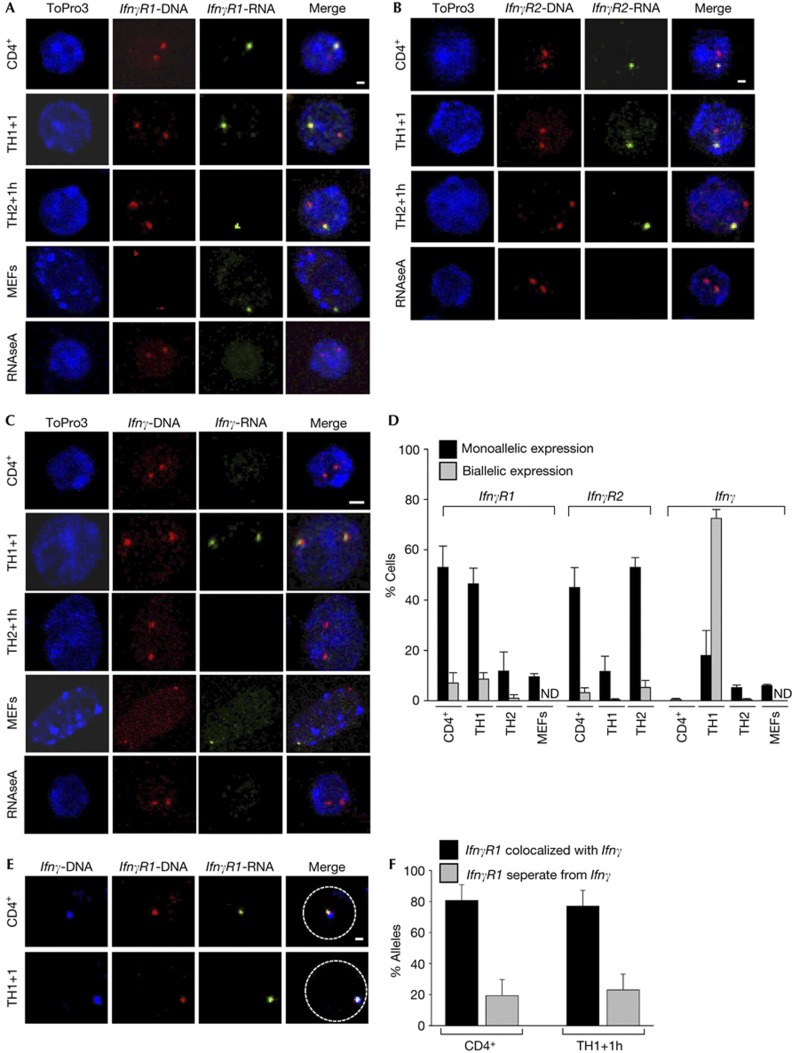
Figure 3.
Monoallelic IfnγR1 gene expression from the allele colocalized with the Ifnγ locus. (A) RNA–DNA FISH for the IfnγR1 gene. Scale bar, 1 μm for T-cell types and 1.5 μm for MEFs. (B) RNA–DNA FISH for the IfnγR2 gene. Scale bar, 1 μm. (C) RNA–DNA FISH for the Ifnγ gene. Scale bar, 2 μm for T-cell types and 2.5 μm for MEFs. (D) Quantitative analysis for the experiments depicted in (A–C). (E) DNA-FISH for the Ifnγ and IfnγR1 gene loci combined with RNA-FISH for the IfnγR1 gene. Scale bar, 1 μm. (F) Quantitative analysis for the IfnγR1-expressing alleles from (E). DNA was counterstained with ToPro3 and pseudocolored blue. DNA-FISH, DNA fluorescence in situ hybridization; MEFs, mouse embryonic fibroblasts; RNA-FISH, RNA fluorescence in situ hybridization.

