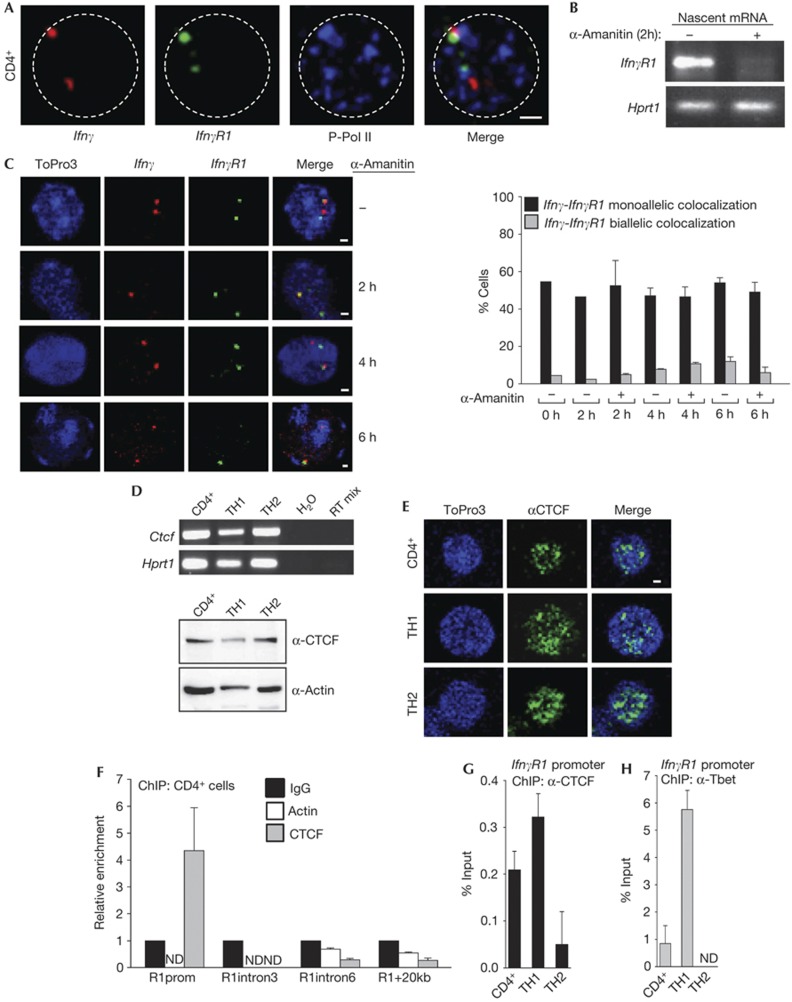
Figure 4.
IfnγR1 promoter binds CTCF and colocalizes with Ifnγ in RNA-PolII factories. (A) DNA-FISH for the Ifnγ and IfnγR1 gene loci in combination with immunofluorescence for the phosphorylated form of RNA Polymerase II in CD4+ cells. (B) Semiquantitative RT–PCR for the nascent IfnγR1 transcript in CD4+ cells treated with 50 μg/ml α-Amanitin. (C) DNA-FISH analysis for Ifnγ-IfnγR1 loci in CD4+ cells treated with 50 μg/ml α-amanitin. Scale bar, 1 μm. (D) Semiquantitative RT–PCR for the Ctcf gene. Lower panel: western blot analysis for the CTCF protein. (E) Immunofluorescence analysis for CTCF. (F) Quantitative PCR analysis for CD4+ cells on chromatin immunoprecipitation. Primer sets are specific for the IfnγR1 promoter/intron 3/intron 6 and a region 20-kb downstream the IfnγR1 gene. (G) Quantitative PCR analysis on chromatin immunoprecipitation using a CTCF antibody and primers specific for the promoter region of the IfnγR1 gene. (H) Quantitative PCR analysis as in (G) using an antibody against T-bet. ChIP, chromatin immunoprecipitation; DNA-FISH, DNA fluorescence in situ hybridization; mRNA, messenger RNA; RT–PCR, reverse transcriptase PCR.

