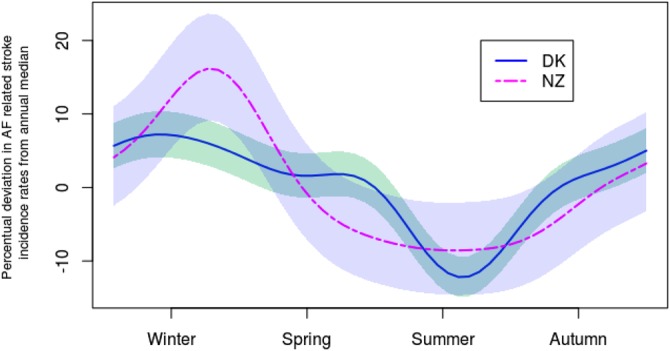
Figure 2.

Estimated seasonal variation in incidence rates of hospitalisation with stroke in patients with atrial fibrillation in Denmark (solid line) and New Zealand (dashed line) adjusted for the overall trend. The seasonal variation is represented as the percentual deviation in incidence rates from annual median, and incidence rates are aggregated to weekly observations. Shaded bands represent 95% CIs.
