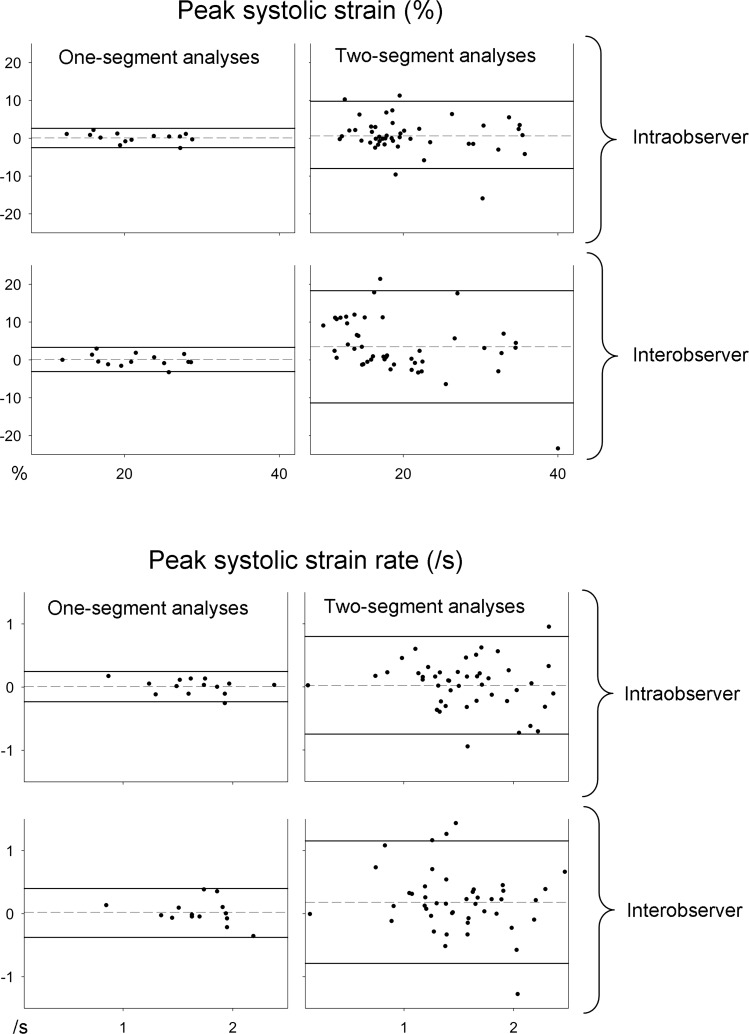
Figure 2.
Bland-Altman plots of the repeatability measurements for one-segment and two-segment32 33 measurements. See the text for details. X-axis: absolute mean of the repeated measurements. Y-axis: difference between the repeated measurements. Dashed line: mean difference in the repeated measurements. Solid lines: 95% limits of agreement.

