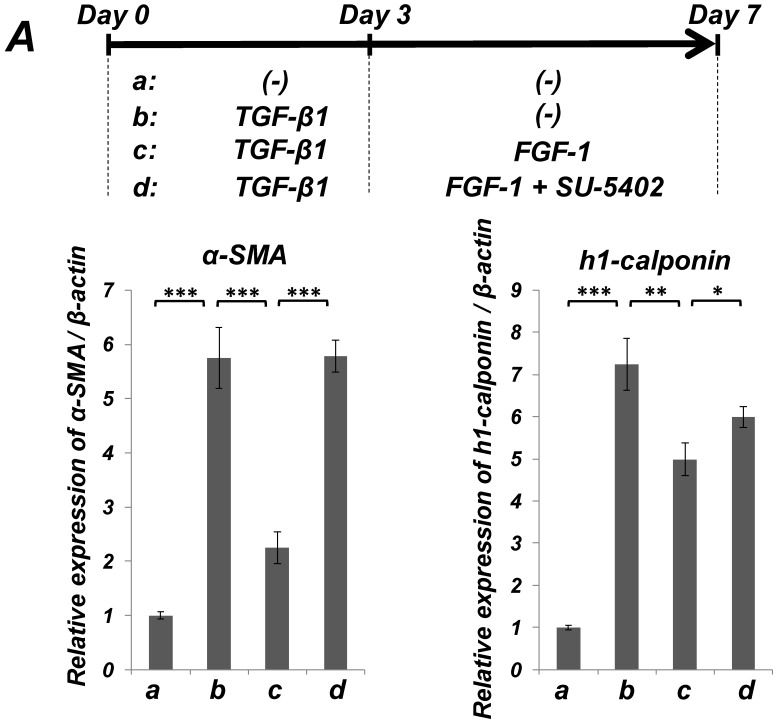
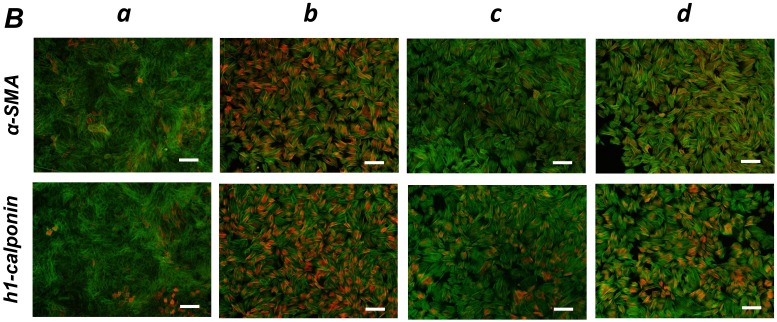
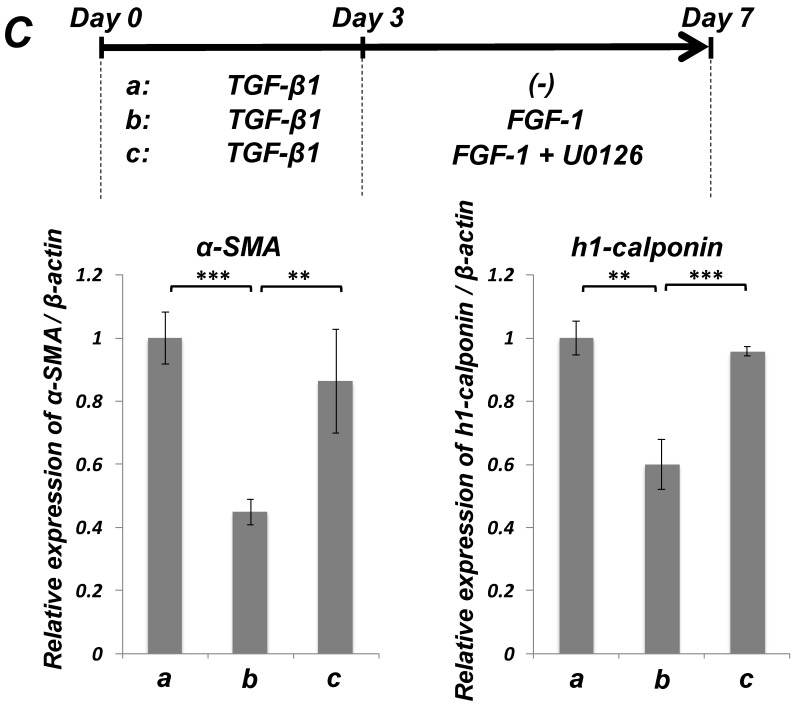
Figure 5.
FGF-stimulation reversed the TGF-β-induced SMC markers expression in PDL-derived EPC-like fibroblastic cells in a MEK-dependent manner. In A, SCDC2 cells were firstly cultured for 3 days in growth medium supplemented with 5% FBS in the absence (experimental course a) or presence of TGF-β1 (3 ng/mL) (experimental courses b, c, and d). Then, the cells were washed with PBS (-) and maintained in new growth medium for 4 additional days in the absence (experimental courses a and b) or presence (experimental courses c and d) of FGF-1 (30 ng/mL). Some of the FGF-stimulated cells were treated with the FGF receptor inhibitor SU-5402 (10 μM) (experimental course d). The relative mRNA expression levels of α-SMA and h1-calponin in the cells at day 7 were analyzed by qRT-PCR as described in Materials and Methods. Data represent the mean ± SD (n = 3). *P <0.05, **P <0.02, and ***P <0.01 were considered significant. In B, cells were treated with TGF-β1, FGF-1 and SU-5402 as described in A (experimental courses a, b, c, and d), and then the protein expression levels of α-SMA and h1-calponin in the cells at day 7 were analyzed by immunocytochemistry. Cells were immunostained with anti-α-SMA (red; upper panels) or anti-h1-calponin antibodies (red; lower panels). Then, the cells were labeled with Alexa Fluor® 488 phalloidin (green) as described in Materials and Methods. Scale bar, 200 μm. In C, SCDC2 cells were firstly cultured for 3 days in growth medium supplemented with 5% FBS in the presence of TGF-β1 (3 ng/mL) (experimental courses a, b and c). Then, the cells were washed with PBS (-) and maintained in new growth medium for 4 additional days in the absence (experimental course a) or presence (experimental courses b and c) of FGF-1 (30 ng/mL). Some of the FGF-stimulated cells were treated with the MEK inhibitor U0126 (10 μM), which was added to the culture 30 min before the FGF-1 administration (experimental course c). The relative mRNA expression levels of α-SMA and h1-calponin in the cells at day 7 were analyzed by qRT-PCR as described in Materials and Methods. Data represent the mean ± SD (n = 3). **P <0.02 and ***P <0.01 were considered significant.


