Figure 1.
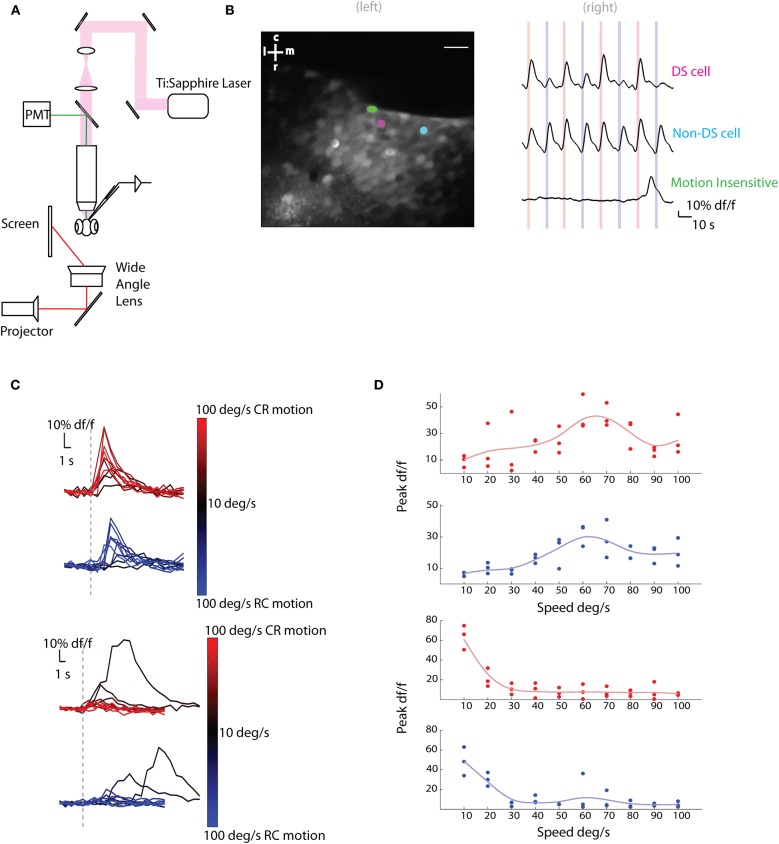
Two-photon calcium imaging of tectal responses to moving bars. (A) Schematic of the experimental setup. Larval zebrafish were placed in a custom chamber (chamber not shown) and presented bars moving caudo-rostrally (CR) or rostro-caudally (RC) to the left eye. Calcium imaging and electrophysiological recordings were performed on the right tectum. (B) (Left) Average image of a two-photon stack with three neurons highlighted as ROIs. Scale bar represents 20 μm (r, rostral; c, caudal; m, medial; l, lateral; 85% of active cells in this example fish were sensitive to motion). (Right) Delta f/f (df/f) traces of the highlighted neurons. Red lines indicate stimulus moving in the CR direction and blue lines indicate RC direction at 60°/s. The cell in magenta was direction selective (DS) for the CR direction, the cell in cyan was non-DS and the cell in green was insensitive to motion. (C,D) In (C), Average df/f responses (n = 3 trials) of two cells to different speeds are shown. Red indicates motion in the CR direction and blue motion in the RC direction. Darker colors imply slower speeds and lighter colors faster speeds. The responses to slowly moving bars are delayed with respect to the onset of the stimulus as the time taken for the bar to enter the receptive fields of the neurons is longer. This is seen in the second cell's (bottom) response to slower stimuli. In (D), the single trial peak df/f responses (filled circles) of the same two cells to bars moving in the CR (red) or RC (blue) directions at different speeds are shown. The responses were fit with a smoothing spline (light blue or red lines) and the preferred speed was estimated. The cell on top shows band-pass tuning, while the cell on the bottom shows low pass tuning.

