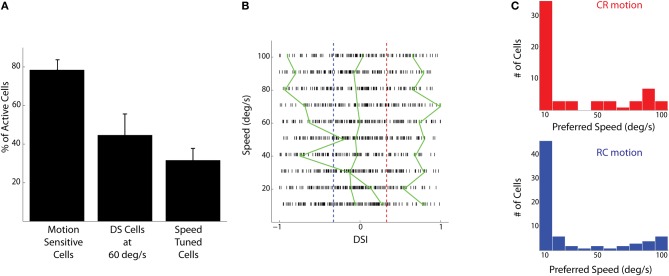
Figure 2.
Population responses to bars moving at different speeds and directions. (A) The percentage of active cells that are motion sensitive, that are direction selective at a speed of 60°/s, and that show responses modulated by speed (mean ± SD). (B) Direction selectivity indices (DSIs) of individual tectal cells at different speeds are shown as raster ticks. Cells to the right of the red dashed line are CR selective and cells to the left of the blue line are RC selective. The green lines show the dependence of DSI on the speed of the stimulus for three cells. The cells shown have low (SD = 0.04), medium (SD = 0.12), and high (SD = 0.44) variability of DSIs at different stimulus speeds. (C) The histogram of preferred speeds for all speed tuned cells in the CR direction (red, n = 61 cells) and RC direction (blue, n = 73 cells).

