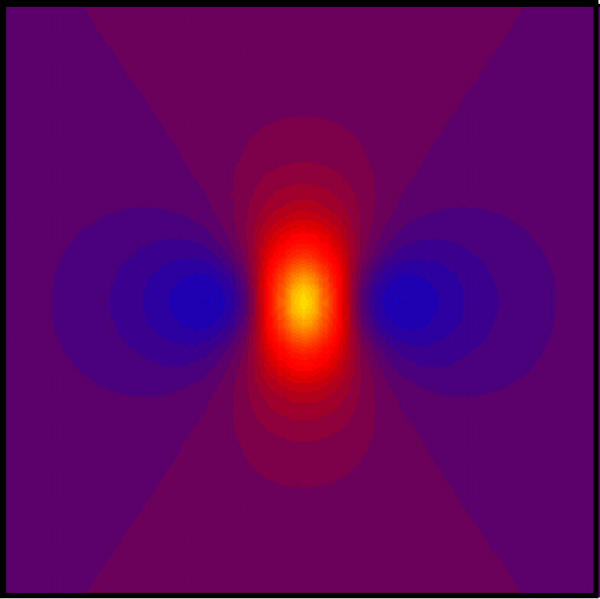
Figure 2.

The transmembrane potential as a function of x and y. The electrode is above the center of the sheet, and the x direction is horizontal. Only the central 10 mm × 10 mm is displayed. The color scale is the same as in Fig. 1. λx = 1 mm and λy = 0.
