Figure 4.

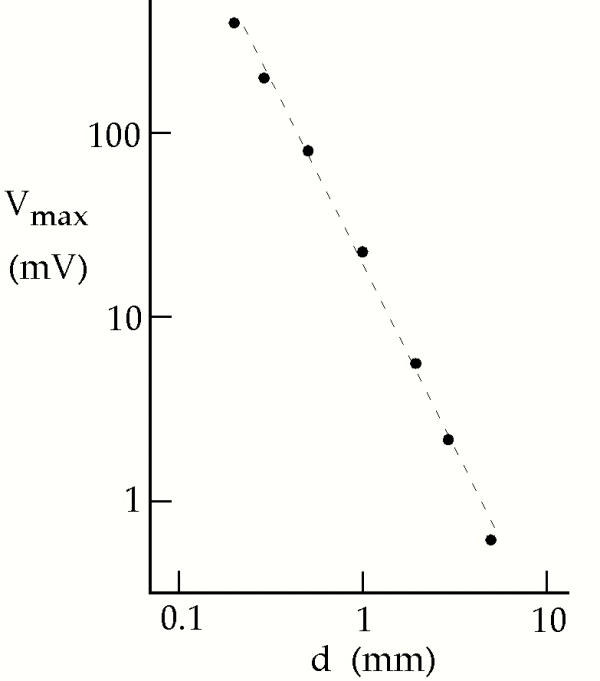
The peak depolarization under the electrode, as a function of distance from the electrode to the tissue sheet, d, for λx = 1 mm and λy = 0.4 mm. The dashed line has a slope of -2 in this log-log plot.

The peak depolarization under the electrode, as a function of distance from the electrode to the tissue sheet, d, for λx = 1 mm and λy = 0.4 mm. The dashed line has a slope of -2 in this log-log plot.