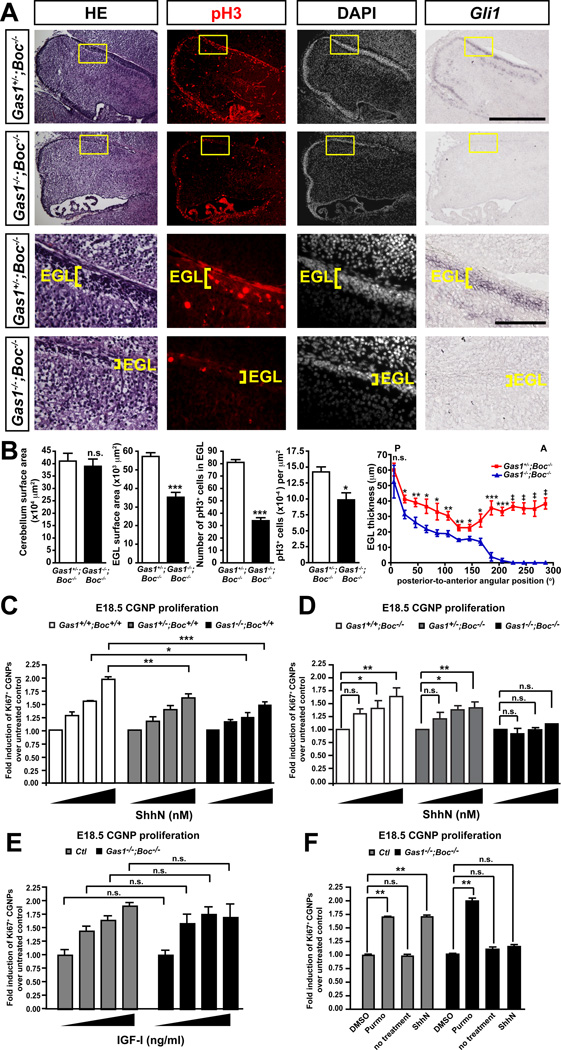
Figure 4. Shh-dependent proliferation is completely lost in Gas1−/−;Boc−/− CGNPs.
(A) Haematoxylin-eosin staining on sagittal sections of E18.5 cerebellum revealing a thinner EGL in Gas1−/−;Boc−/− cerebella than control. Anti-pH3 immunostaining of sagittal sections of Gas1+/-;Boc−/− and Gas1−/−;Boc−/− cerebella counterstained with DAPI. RNA in situ hybridization showing the loss of expression of the Shh transcriptional target Gli1 in Gas1−/−;Boc−/− cerebella at E18.5. (B) Quantification of: cerebellum surface area, EGL surface area, pH3+ cells in EGL, pH3+ cells per µm2, and EGL thickness along the postero-anterior axis, n=4 animals/group. (C) CGNPs purified from Gas1+/+;Boc+/+ (n=3), Gas1+/-;Boc+/+ (n=4) and Gas1−/−;Boc+/+ (n=4) mice cerebella at E18.5 were cultured with 0, 3, 10, 30 nM ShhN. Proliferating cells were visualized by immunostaining with an anti-Ki67 antibody. Data is represented as fold CGNP proliferation over untreated control (C, D and E) or DMSO control (F). (D) Similar to (C) but CGNPs were purified from Gas1+/+;Boc−/− (n=3), Gas1+/-;Boc−/− (n=3) and Gas1−/−;Boc−/− (n=3) mice cerebella at E18.5. (E) CGNPs were purified from control (Ctl; Gas1+/+;Boc−/− and Gas1+/-;Boc−/−) (n=3) and Gas1−/−;Boc−/− (n=3) mice cerebella at E18.5 and treated with 0, 20, 50 or 100 ng/ml of IGF-I. (F) Similar to (E) but CGNPs were treated with either DMSO, 0.150 µM purmorphamine, or 30 nM ShhN. p values measured from Student’s t-test (B), two-way ANOVA (C, E), and ANOVA (D, F). EGL, external germinal layer. Scale bars: top two rows=500 µm, bottom two rows=100 µm.

