
Figure 1.
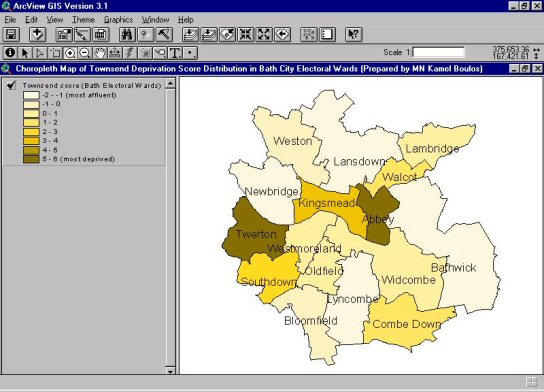
A simple choropleth map of Townsend Deprivation Score distribution in Bath City Electoral Wards A simple choropleth (graduated colour) map of Townsend Deprivation Score distribution in Bath City Electoral Wards (UK). Abbey and Twerton are the most deprived wards (highest scores/darkest shade). (Prepared using ESRI ArcView GIS Version 3.1 http://www.esri.com/software/arcgis/arcview/index.html and data from EDINA UKBORDERS and Census Dissemination Unit (CDU)/MIMAS.