
Figure 8.
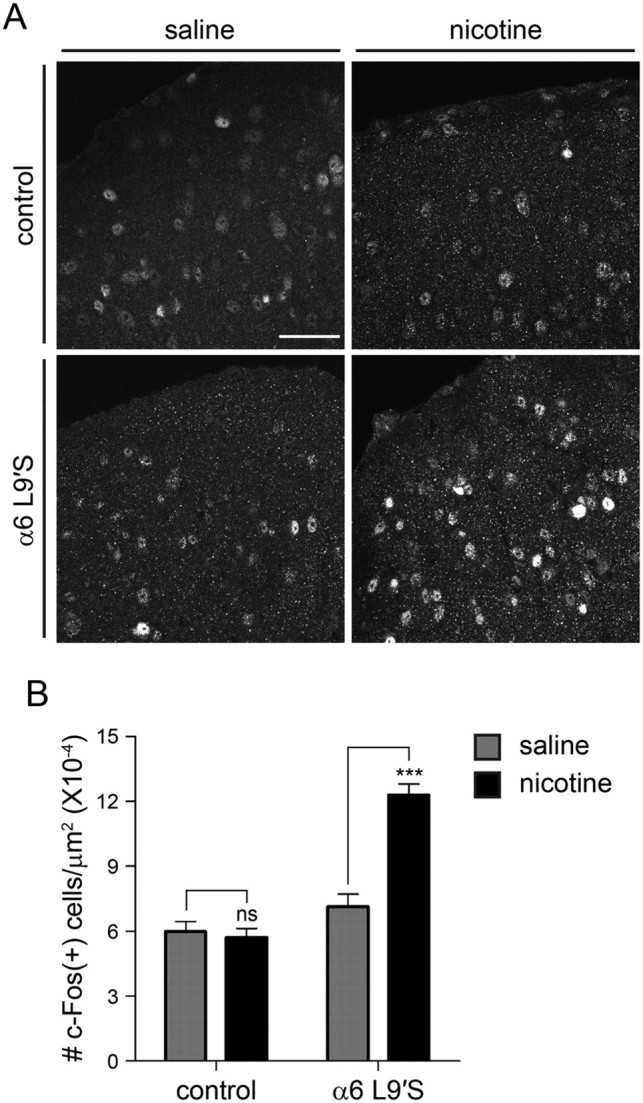
Activation of sSC α6* nAChRs in vivo. A, Induction of c-Fos expression following nicotine injections in control and α6 L9′S mice. Mice of the indicated genotype were injected with saline or nicotine (0.15 mg/kg; i.p.), perfused, and brains were removed and sectioned for anti-c-Fos staining. Representative sSC-containing brain sections stained with anti-c-Fos antibodies are shown for control and α6 L9′S mice. Scale bar, 50 μm. B, Quantification of c-Fos staining. Images (n = 10 for each genotype) of c-Fos-stained sSC brain sections, sampled from multiple bregma levels, were analyzed for the number of c-Fos immunoreactive cells per square micrometer of brain tissue. Results from saline and nicotine injections for control and α6 L9′S mice are plotted. Data are mean ± SEM. A Student's t test was used to compare saline versus nicotine within mouse lines; ***p < 0.0001.