
Figure 2.
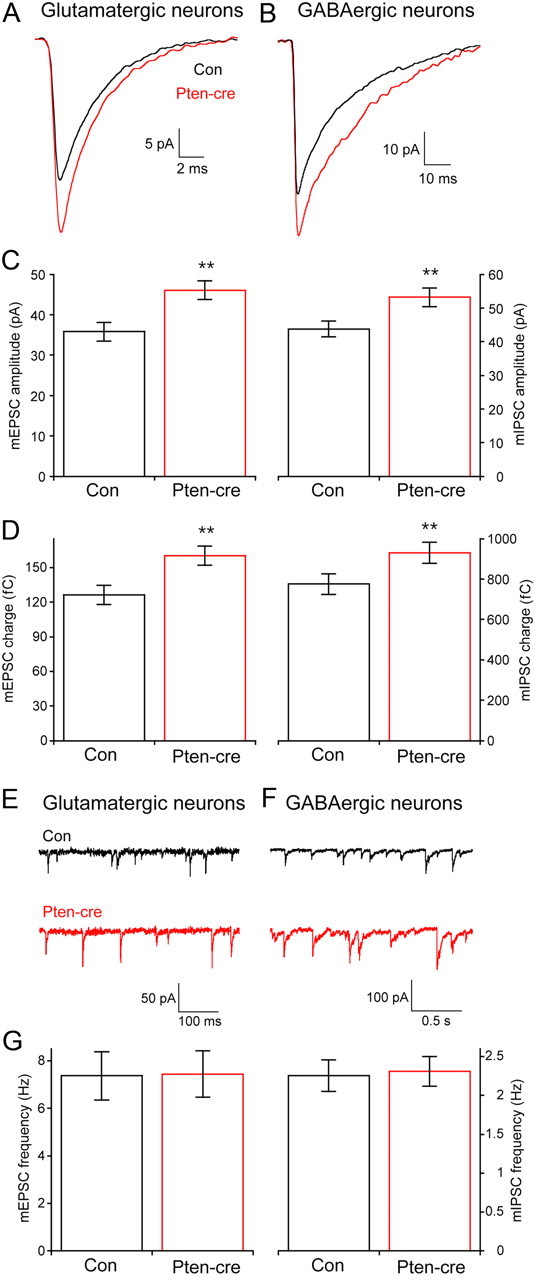
Loss of Pten increases the amplitude but not the frequency of glutamatergic and GABAergic miniature events. A, Representative traces showing the average of mEPSCs collected from one control (black trace) and one Pten-cre (red trace) glutamatergic neuron. B, Representative traces showing the average of mIPSCs collected from one control (black trace) and one Pten-cre (red trace) GABAergic neuron. C, Peak amplitudes of mEPSCs from glutamatergic (left) and mIPSCs from GABAergic (right) neurons. D, The charge contained in the mEPSCs of glutamatergic (left bars) and mIPSCs of GABAergic (right bars) neurons. E, F, Representative traces showing control (black traces) and Pten-cre (red traces) miniature postsynaptic current activity from glutamatergic (E) and GABAergic (F) neurons. G, Bar graph showing no significant difference in the miniature event frequency between control and Pten-cre neurons in glutamatergic (left bars) and GABAergic (left bars) neurons. All values are presented as mean ± SEM. **p ≤ 0.01.