
Figure 4.
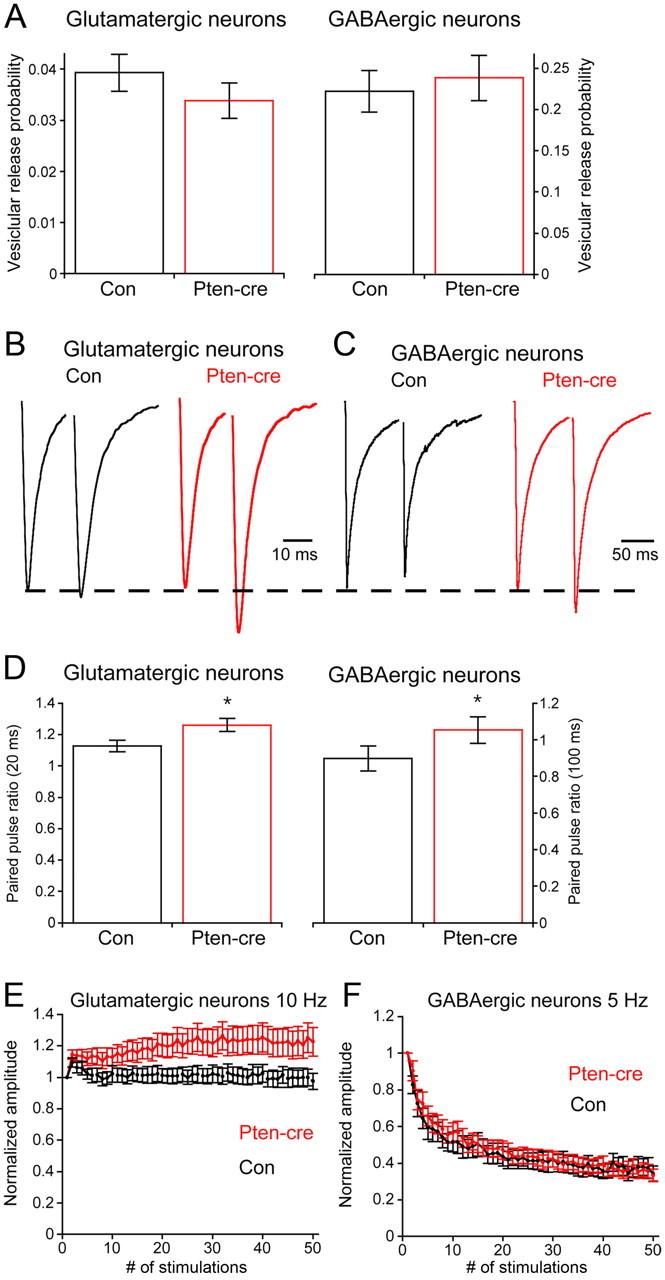
Presynaptic neurotransmitter release efficiency in Pten-cre neurons. A, The probability that an individual synaptic vesicle fuses in response to a 2 ms depolarization (Pvr) in control (black) and Pten-cre (red) neurons. B, Representative traces of the response of control (black trace) and Pten-cre (red trace) glutamatergic neurons to paired 2 ms depolarizations separated by 20 ms. C, Representative traces of the response of control (black trace) and Pten-cre (red trace) GABAergic neurons to paired 2 ms depolarizations separated by 100 ms. D, Paired pulse ratios in control (black) and Pten-cre (red) neurons. E, Line plot of the responses of control (black line) and Pten-cre (red line) glutamatergic neurons to 10 Hz stimulation. Values are normalized to the peak amplitude of the first response in the train. F, Line plot of the responses of control (black line) and Pten-cre (red line) GABAergic neurons to 5 Hz stimulation. Values are normalized to the peak amplitude of the first response in the train. All values are presented as mean ± SEM. *p ≤ 0.05.