
Figure 7.
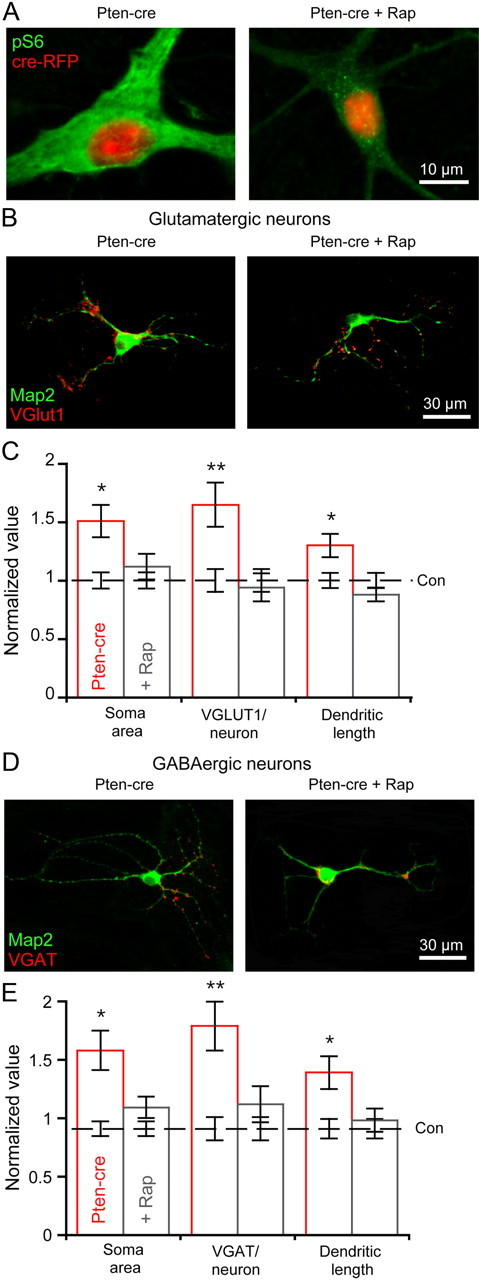
Seventy-two hour rapamycin treatment normalizes dendritic length and synapse number. A, Representative images of a vehicle-treated Pten-cre (left) and rapamycin-treated Pten-cre (right) neuron infected with the cre-RFP-expressing lentivirus showing the fluorescence from the RFP fusion protein (red) and the immunoreactivity against phospho-S6 (green). B, Representative images from vehicle-treated (left) and rapamycin-treated (right) Pten-cre glutamatergic neurons showing immunoreactivity for MAP2 (green) and VGLUT1 (red). C, Normalized values (mean ± SEM) for the soma area, VGLUT1 punctae per neuron, and dendritic length of vehicle-treated (red bars) and rapamycin-treated (gray bars) glutamatergic Pten-cre neurons. The values are normalized to the corresponding values from vehicle-treated control neurons, which are represented by the dashed black line and surrounding error bars. D, Representative images from vehicle-treated (left) and rapamycin-treated (right) Pten-cre GABAergic neurons showing immunoreactivity for MAP2 (green) and VGAT (red). E, Normalized values (mean ± SEM) for the soma area, VGAT punctae per neuron, and dendritic length of vehicle-treated (red bars) and rapamycin-treated (gray bars) GABAergic Pten-cre neurons. The values are normalized to the corresponding values from vehicle-treated control neurons, which are represented by the dashed black line and surrounding error bars. All statistical tests are one-way ANOVA with a Student–Newman–Keuls post-test. *p ≤ 0.05; **p ≤ 0.01 versus control.