
Figure 3.
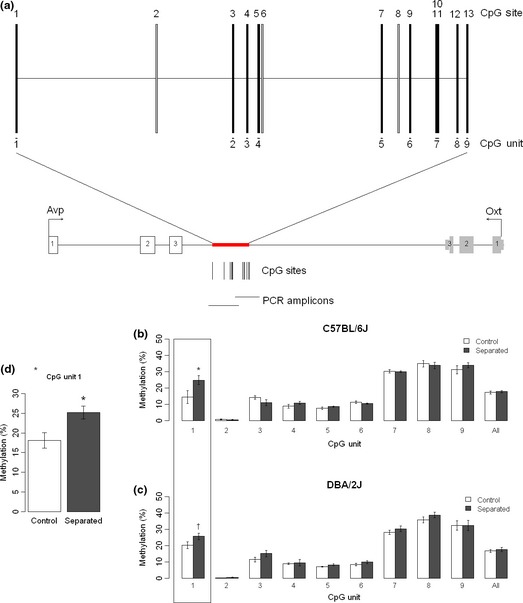
Avp. (a) Schematic diagram showing the Avp and Oxt (oxytocin) genes, orientated with the Avp gene reading forwards. Exons are indicated by the numbered boxes. The red box highlights the region assessed for DNA methylation in this study. Individual CpG sites are represented by black lines: gray lines show CpG sites unable to be assessed by our method. CpG units (individual sites or groups of sites) are indicated underneath the CpG sites. These unit numbers correspond to the graph showing mean (±SEM) methylation percentages. (b–c) Percentage methylation across CpG Units in the Avp CGI3 region. (d) Maternally separated males in both strains have increased methylation at CpG Unit 1 in Avp assay CGI3b (P < 0.05).