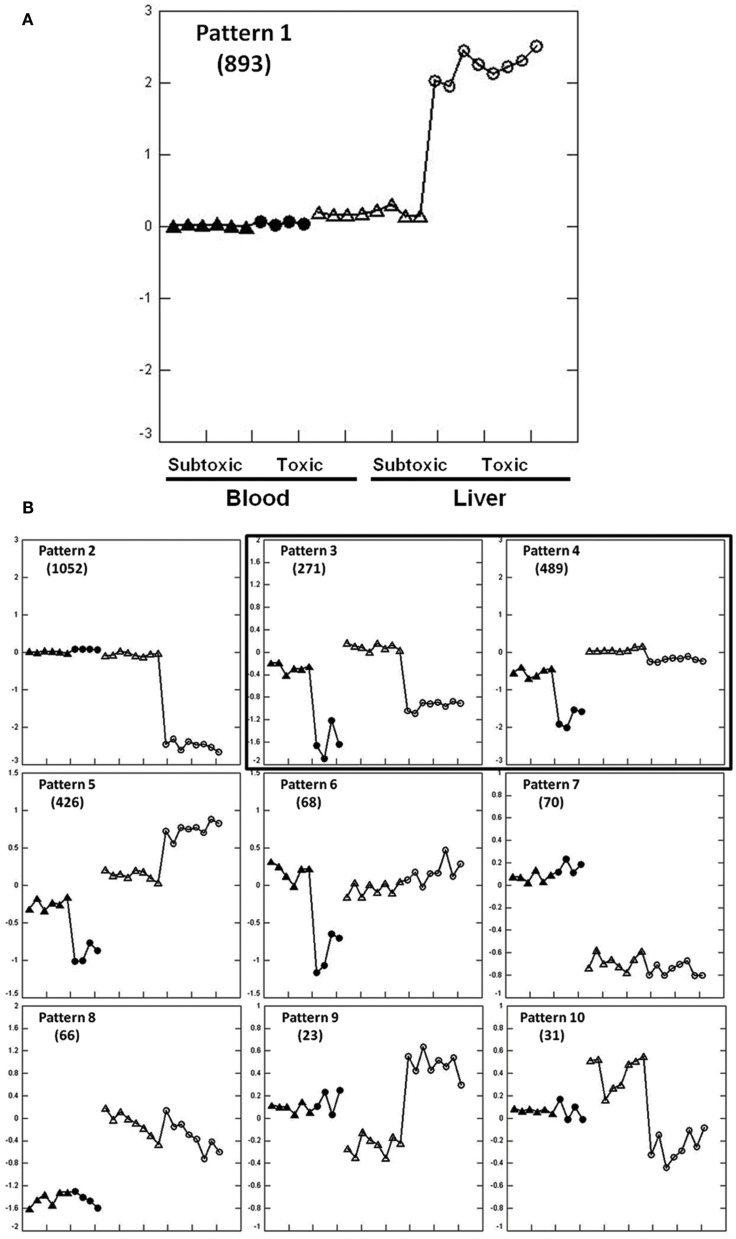
Figure 1.
Expression patterns at 6 h after APAP treatment extracted by EPIG for the training set animals. Pattern 1 is enlarged to clarify the displays (A). The y-axis is the average log base 2 of the ratio values from the top six profiles within the pattern. The ratio value is computed from the intensity measurement for each gene in each treatment sample compared to the average of the time-matched control for the sample. Zero at mid scale represents no change in gene expression, above zero means up-regulation and below zero means down-regulation. Two arrays were hybridized with Cy3 and Cy5 dye swap from one animal, so two dots represent one rat. Within a single pattern from the left to the right: blood (solid dots) and liver (empty dots); within the same tissue from left to right, subtoxic dose (triangle), and toxic doses (circle). Other gene expression patterns are shown in (B). Gene numbers for each pattern are shown in parentheses. Only pattern 3 and 4 contain genes that were similarly regulated in liver and blood.

