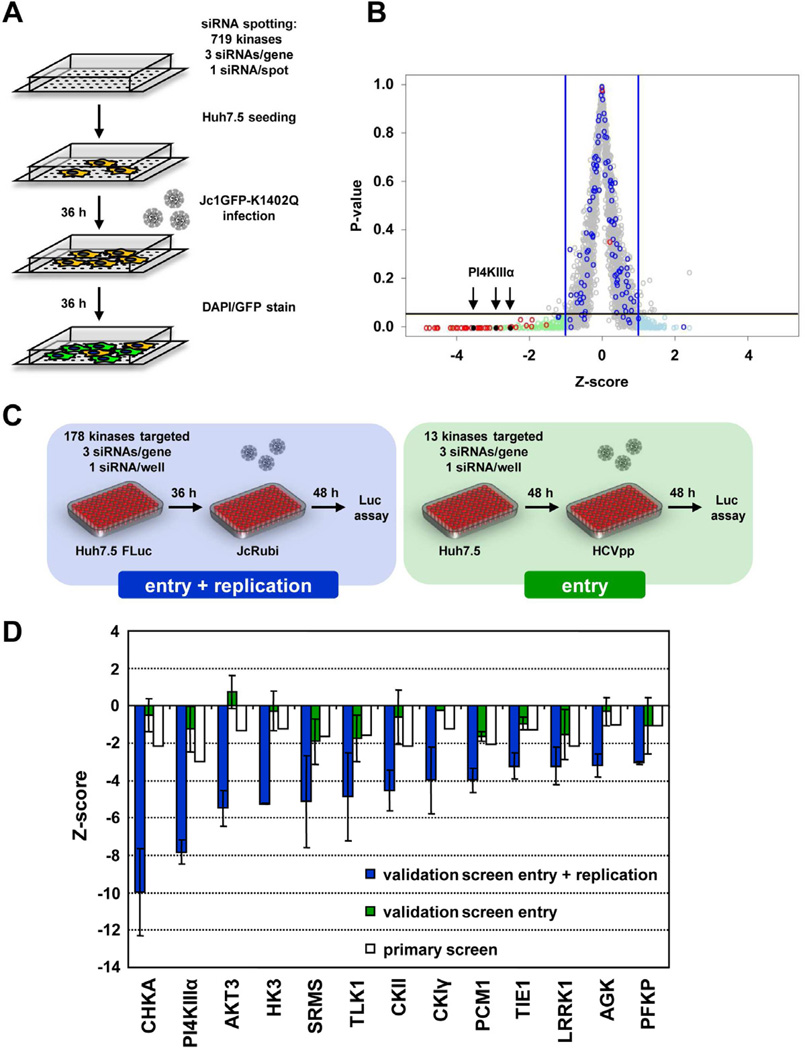
Fig. 1. High throughput siRNA screen to identify kinases involved in HCV entry and replication.
(A) Assay setup of the primary siRNA screen. Each chamber slide was coated with 384 different siRNA spots. Huh7.5 cells were infected 36 h after seeding and another 36 h later, cells were fixed and stained. (B) Virus specific signal intensities obtained in the primary screen were quantified and values were normalized intra- and inter-slide wise as well as between the 12 repetitions. Mean z-scores for all siRNAs tested are depicted in grey. Z-scores of negative and positive controls are highlighted in blue and red, respectively. With a hit criterion of −1 > z > 1 and a p-value < 0.05 indicated by the blue and black bars, respectively, 83 potential dependency and 95 potential restriction factors were identified (light green and light blue, respectively). Positions of PI4KIIIα hits are indicated by arrowheads. (C) Assay setup of the entry and replication validation screen (left panel). For each candidate 3 unique siRNAs were tested in a 96-well plate format. Huh7.5 FLuc cells were infected with JcR-ubi to measure effects of the silencing on HCV entry and replication (4 repetitions). To measure effects of the silencing of validated hits on entry (right panel), Huh7.5 cells were infected with HCVpp containing a FLuc reporter gene and luciferase activity was determined 48 h later (7 repetitions). (D) Summary of mean z-scores of hits determined in the two independent validation screens. Z-scores determined in the primary screen (white bars) are shown for comparison.

