Abstract
Image mapping spectrometry (IMS) is a hyperspectral imaging technique that simultaneously captures spatial and spectral information about an object in real-time. We present a new calibration procedure for the IMS as well as the first detailed evaluation of system performance. We correlate optical components and device calibration to performance metrics such as light throughput, scattered light, distortion, spectral image coregistration, and spatial/spectral resolution. Spectral sensitivity and motion artifacts are also evaluated with a dynamic biological experiment. The presented methodology of evaluation is useful in assessment of a variety of hyperspectral and multi-spectral modalities. Results are important to any potential users/developers of an IMS instrument and to anyone who may wish to compare the IMS to other imaging spectrometers.
Keywords: hyperspectral imaging, imaging spectrometer, calibration, characterization, spectral unmixing
1 Introduction
Hyperspectral imaging (HSI) is utilized throughout the fields of astronomy,1 remote sensing,2 food science,3 and biotechnology.4 By collecting both spatial and spectral information about an object, it provides a full three-dimensional (3-D) distribution, called a hyperspectral datacube. Linear unmixing or other spectral analysis algorithms can use this spatial-spectral dataset in order to identify concentrations of chemicals within a scene.5 Traditional hyperspectral imagers implement a temporal scanning technique to sequentially collect the hyperspectral datacube by either point-scanning, line-scanning, wavelength-scanning, or compressive sampling.6 These systems include pushbroom, whiskbroom, liquid-crystal tunable filter (LCTF), acousto-optic tunable filter (AOTF), digital micromirror device (DMD),7 and Fourier transform8,9 based imaging spectrometers. More recently, a class of hyperspectral imagers has come forward that collects the entire datacube simultaneously. Some examples of such systems are the computed tomographic imaging spectrometer (CTIS) and the coded aperture snapshot spectral imager (CASSI).10–12 These “snapshot” instruments incorporate specialized components to distribute an object's 3-D spatial-spectral information onto a two-dimensional (2-D) focal plane array. A transformation is then used to reconstruct the 3-D hyperspectral datacube from the 2-D image recorded on an image sensor.
Another class of snapshot HSI systems provides all spatial-spectral information on a single or multiple CCD image sensors with a one-to-one correspondence between datacube voxels and detector pixels. There are three major modalities in this group: image slicers,13 field splitting by fibers14 or lenslet arrays,15 and image mapping spectrometers (IMS).16–18 By collecting information simultaneously, while utilizing simple datacube remapping algorithms, these systems add several powerful capabilities to HSI, including faster data collection and image reconstruction, higher light-throughput, less motion artifacts, and real-time spectral unmixing. These features enable applications that require the ability to distinguish objects with similar spectral properties at high temporal resolution. Of particular interest is an IMS system that demonstrates high spatial sampling of 355 × 350 over 41 wavelengths, using a single large format CCD image sensor. A calibration procedure determines a lookup table that is used for reconstruction; this process accounts for distortion and stretch in the raw CCD image. Reconstruction is then performed with a simple indexing operation of the CCD frame and is executed much faster than the nominal frame rate of the camera, which is 7.2 frames per second. It also provides high light throughput of above 50%. In the field of bioscience, the IMS has been used to investigate cellular dynamics with multiple fluorescent biomarkers19 to perform real-time brain imaging20 and for endoscopic imaging of oral mucosa.21
While previous publications presented datacubes and experimental results that show IMS' basic performance,16–21 a detailed discussion of system calibration and characterization of its operational limits has not yet been published. In Sec. 2, this paper sites the current literature related to IMS calibration and hardware performance. In Sec. 3, an improved spatial-spectral calibration procedure is presented for the IMS. This new method is necessary to account for imperfections in raw detector data. Section 4 describes a suite of tests developed to measure optical performance of the IMS after calibration. The measured performance metrics are linked to imperfections in optical components/assembly as well as system calibration. The tests can readily be applied to other microscope-coupled hyperspectral devices (image slicers, pinhole systems, etc.). In Sec. 5, motion artifacts and spectral linear unmixing of the IMS are tested with a real-time biological experiment. The results of the performance tests provide the first benchmark for IMS technology. Potential users/designers of IMS instruments can draw from the tests and analyses in order to design experimental setups, evaluate their systems, or compare to other imaging spectrometers.
2 Background
The detailed principle of the IMS system operation was first described in Ref. 17. It is useful to briefly describe how the IMS operates in order to discuss calibration requirements and relate performance results to hardware components. Here we limit the discussion to focus on the principle/component impact on imaging performance.
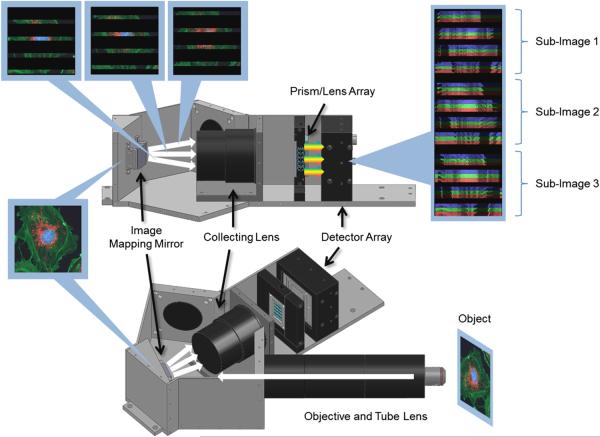
The IMS breaks an image into zones to create void regions. This is accomplished through a specially designed mirror and an array of re-imaging systems. The image zones are then dispersed and spatial-spectral information from the object is recorded on a CCD image sensor. The essential component is the “image mapping mirror” also called an image mapper. The component is placed in the image plane of fore optics and in its simplest form is a faceted mirror composed of many reflective long strips. The facets of the mirror have different 2-D tilt angles that reflect image zones into different directions. Figure 1 shows a schematic of the IMS system that contains a simplified mirror with only 12 facets. The image mapping mirror used in the evaluated system has 355 facets.
Fig. 1.
The operating principle of the IMS system.
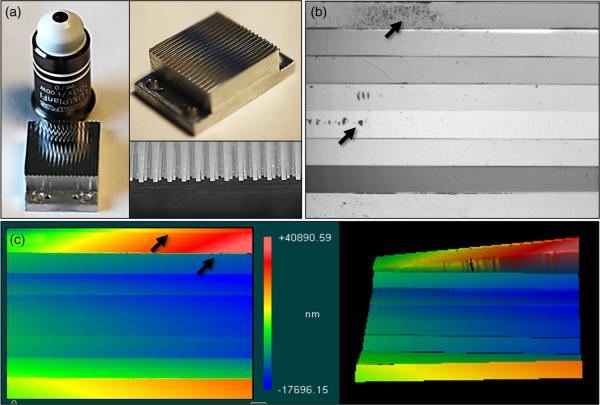
For the purposes of this publication, the authors will not analyze optical design and tolerance analysis since this topic was already discussed in Refs. 16 and 21. We will focus here on evaluation of the performance of the system “as is,” which may help potential users/builders characterize their systems. The image mapping mirror design, fabrication, and optical characterization was discussed in Ref. 18. The authors showed that the fabrication process results in imperfections within mirror facets, such as surface form errors, roughness, and width variations (as shown in Fig. 2). Since the facets lie at an intermediate image plane, these imperfections produce artifacts in the collected data. In this paper, we discuss how these imperfections affect reconstructed datacubes.
Fig. 2.
(a) The image mapping mirror is composed of 350 reflective facets that are 65 μm × 25 mm long, each with a 2-D tilt angle to redirect image zones. (b) A close-up image of eight mirror facets with roughness and debris indicated. (c) White light interferometry data shows roughness on facets as well as edge artifacts.
The sliced and dispersed raw IMS image is not “human readable” and must be remapped in order to reconstruct a spatial-spectral datacube. A basic, proof-of-concept mapping calibration procedure was presented in Ref. 16. This approach did not account for monochromatic and polychromatic distortions, defocus, or clipping within the optical train of the system. The reconstruction of datacubes using this previous calibration method produced datacubes with lateral chromatic aberration and spatial misalignments.
3 Calibration
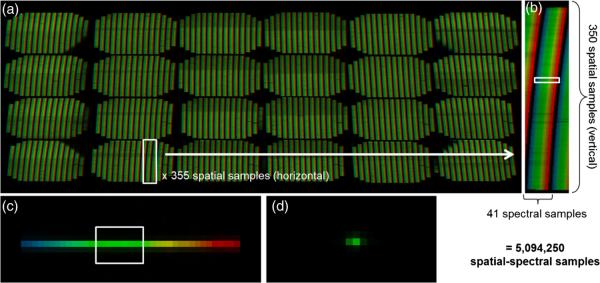
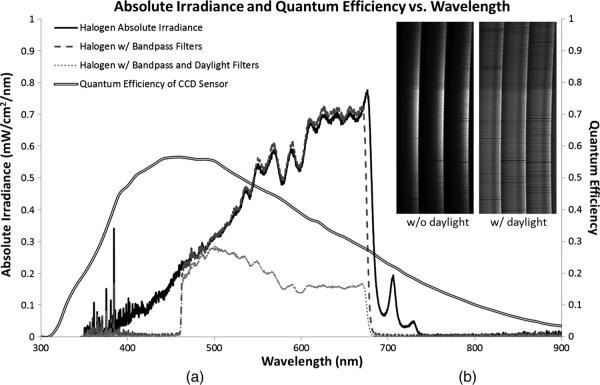
The calibration procedure discussed here has not been published, but it has been used to calibrate the systems described in our previous publications.19–22 In order to clarify the calibration procedure, we will first briefly describe the raw data from the IMS evaluated in this paper. Our experimental system contains an image mapping mirror with 355 mirror facets that redirect image zones into 24 different subimages on the detector (corresponding to four vertical and six horizontal facet tilt angles). Redirected lines from the object are separated by 41 pixels, which allows for 41 pixel spectral sampling. Figure 3 shows false-colored raw data from the IMS. The data in Fig. 3(a) and 3(b) is recorded from an empty microscope stage lit with Koehler illumination from a halogen lamp. A neutral density filter and a daylight filter were used to match the spectral density of the lamp to the sensitivity of the CCD, which created a uniform detector signal over the broad spectrum, as illustrated in Fig. 4. The spectral range was limited to 470 to 670 nm using a bandpass filter in order to prevent overlap of dispersed light between adjacent facets. Figure 3(c) shows a subsection of the IMS's CCD imaging a pinhole illuminated with 470 to 670 nm light; here one pixel of spatial information and 41 pixels of dispersed spectral information are recorded. Figure 3(d) is the raw data from a pinhole illuminated with narrowband 550/-nm light.
Fig. 3.
The IMS detector response to different spatial and spectral samples. (a) Detector response to uniform sample illuminated with white light (false-colored to illustrate spectral content). (b) Close-up of one dispersed facet image, which corresponds to the spatial-spectral information of one line in the object. (C) Response to spatial pointsource (i.e. a pinhole) illuminated with white light. (d) Response to a spatial pointsource illuminated with narrowband (550/1 nm) light.
Fig. 4.
(a) Raw and spectrally filtered absolute irradiance in the calibration setup as measured by an Ocean Optics point spectrometer. (b) IMS detector images show more uniform spectral response to spectrally filtered illumination.
We primarily use the IMS to image thin microscope samples with negligible depth information, therefore our calibration establishes a one-to-one correspondence between each voxel in the hyperspectral datacube (x, y, λ) and a pixel location on the CCD camera (u, v).16 The complete calibration procedure consists of three steps: (1) remapping with the transformation lookup table (x, y, λ) = T−1{(u, v)}, (2) flat-field correction, and (3) spectral sensitivity correction.
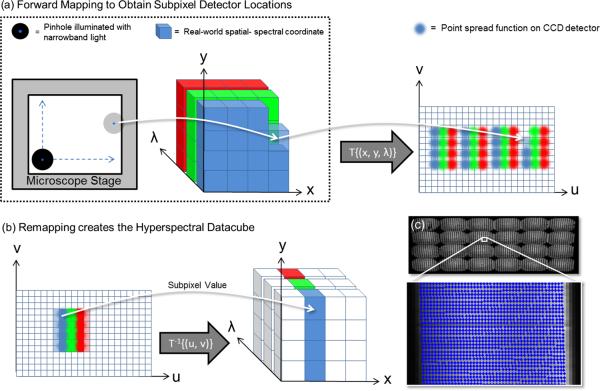
The goal of the mapping calibration step is to determine (x, y, λ) = T−1{(u, v)}. T−1 is effectively a lookup table that is the same size as the datacube, which contains a subpixel detector value at each index. In order to determine T−1, the forward mapping T is found first by sequentially illuminating integer coordinates (x, y, λ) throughout the datacube while analyzing the detector (u, v) response. Once we establish the relationship T from scene to detector, we can apply the reverse mapping T−1 or “remapping” to transform raw detector data into a datacube. The procedure works by scanning a spatial pattern (e.g., a pinhole) illuminated with narrow bandfilters throughout the field of view (FOV) of the IMS system at (x, y, λ) object coordinates. Four narrowband filters were used, because this is the minimum quantity needed to sample the nonlinear dispersion curve of the prisms. Each position of the spatial pattern provides a point image in a region on the detector [Figs. 3(d) and 5(a)]. The subpixel center position (u, v) of the point image is determined with a peak-finding algorithm.23 Forward mapping and reverse mapping are conceptually illustrated in Fig. 5. Parameters used during the calibration procedure are shown in Table 1. Remapping the datacube c using the lookup table is implemented in real-time using bicubic interpolation24 of raw detector data. Section 4.4 evaluates the accuracy of remapping.
| (1) |
| (2) |
Flat-field correction is also performed in order to account for intensity variations in the raw image. The procedure starts by recording a datacube i from an empty microscope stage lit with halogen lamp Koehler illumination. All subsequent datacubes c acquired by the IMS are divided by the datacube acquired with Koehler illumination. This normalizes the response of every datacube voxel. Next the spectral sensitivity is corrected. Each of the N spectral images λ within the datacube is multiplied with a correction factor s to match the corresponding intensity of the halogen lamp spectrum, as determined by a calibrated point spectrometer. The final datacube includes both flat-field and spectral correction of the raw detector data.25
Fig. 5.
Sequential experimental calibration procedure. (a) Each element of object space (x, y, λ) can be illuminated sequentially with a spatial-spectral point source while recording the detector (u, v) response. The forward mapping of object coordinates to detector space describes T[(x, y, λ)} → (u, v). (b) Applying the remapping T−1{(u, v)} → (x, y, λ) allows the object datacube to be accurately reconstructed from raw data. (c) Subpixel coordinates obtained from the mapping calibration are overlaid on raw detector data.
Table 1.
Calibration parameters and settings for the evaluated IMS system.
| Calibration parameter | Value |
|---|---|
| Microscope objective, IMS relay objective | 5×, 2.5× |
| Image mapper dimensions | ~23.4 ×26 mm2, 65 μm facets |
| Slit size, slit size after magnification | 5 μm × 5 mm, 62.5 μm × 62.5 mm |
| Spatial samples perpendicular, parallel to facets (x, y) | 667, 120 |
| Motorized stage step size (x, y) | 3 μm, 16 μm |
| Spectral samples (x, y) | 1 (determines facet order), 4 (determines dispersion) |
| Total images recorded, total disk space compressed | 1147 images, ~100 MB |
4 IMS Evaluation Tests
There are no established standards for performance evaluation of snapshot hyperspectral imagers. For that reason, in order to assess the hyperspectral datacubes obtained from the calibrated IMS, we developed a suite of tests to measure different metrics of data quality. We decided to evaluate three categories of IMS data quality: intensity parameters, mapping errors, and overall performance. Intensity parameters are inherent to the hardware of the system and are evaluated with tests for intensity variation, light throughput, and scattered light. Mapping errors are dependent on the accuracy of the calibration lookup table and are evaluated with tests for geometric error, image stretch, and spectral image coregistration. Overall optical performance tests include spatial resolution, spectral resolution, and spectral accuracy/variability. While some of the tests are specific to the IMS instrument, many of the procedures can also be used to measure performance of other HSI techniques. The IMS specific tests are indicated with asterisks in Table 2. Each section below summarizes the algorithm used for the test and the results found for the calibrated IMS.
Table 2.
Measured parameters of the IMS system.
| Intensity parameters | Mapping errors | Overall performance |
|---|---|---|
| Intensity variation* | Geometric error | Spectral accuracy/ variability |
| Light throughput* | Stretch | Spectral resolution |
| Scattered light | Coregistration | Spatial resolution |
Note: Tests without an asterisk (*) can also be used to evaluate other imaging spectrometers.
During testing the IMS system was coupled to the side port of a Zeiss Axio Observer inverted microscope. Two spatial targets were used: a Ronchi ruling rotated at 0 deg, 45 deg, and 90 deg, and a high-resolution 1951 USAF resolution target. Several narrowband and plastic transmission filters were used to evaluate spectral performance. All remapped datacubes were obtained according to the calibration procedures described previously.
4.1 Intensity Variation
Ideally, the intensity of reflected light collected from the image mapping mirror should be constant. In reality, the uniformity of the detector image is affected by the image mapper quality,18 the reimaging optical train, and the CCD response. It is important to measure variations in the raw detector image because they correspond to loss in dynamic range. For example, if one facet image or a portion of a facet image is less intense than another, then this area will have lower signal-to-noise ratio and dynamic range. During calibration, flat-field correction was used to aesthetically compensate nonuniformities in the datacube.25
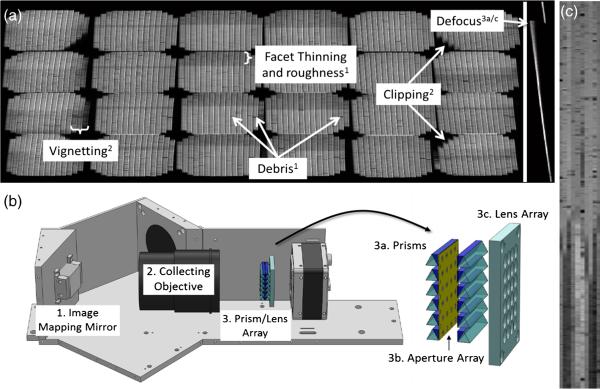
To assess the amount of total system nonuniformity, Koehler illumination was used in transmission mode with a halogen lamp to uniformly irradiate an empty microscope stage. Figure 6(a) shows raw data from the IMS obtained with this setup. Facet images do not have a constant intensity value within or between facets. Figure 6(b) shows the optical components that most likely contribute to these intensity variations in the data. For example, imperfection in mapper fabrication causes debris and roughness on facets, which create localized decreases in image intensity. Light that is clipped by the collecting objective creates regions of missing information in the corner subimages. Also, prism/lens array alignment can cause defocus of facet images, which reduces intensity. These artifacts affect other important metrics of datacube quality in addition to intensity variation. For example, defocus of a facet image will cause blur in the direction of spectral dispersion, which reduces spectral resolution, as discussed in Sec. 4.6. Figure 6(c) reveals a close-up reconstruction of nine uniformly illuminated facet images in the image mapping mirror. Contrast has been enhanced to highlight the overall change in intensity that can be seen on each reconstructed line.
Fig. 6.
(a) Left: A flat-field broadband image from the IMS with varying facet image intensity. Right: A close-up of a flat-field narrowband facet image from the IMS, showing defocus of the facet. These design, fabrication, and assembly limitations cause intensity variations in the raw data. The superscript number corresponds to the system component in (b), which causes the problem. (c) A contrast-stretched image of nine facets after remapping shows overall and localized facet image nonuniformities. These flaws also translate to reduced resolution, missing data and/or geometric errors in the remapped datacube.
A Matlab script was written to quantify variation of facet image intensities on the detector, which is an overall measure of image mapper variations, vignetting, clipping, prism/lens array affects as well as reconstruction. To quantify the uniformity of intensity within facet images, the relative standard deviation (%RSD) was calculated for each facet image in the panchromatic flat-field image, defined as the sum of all spectral channels. The %RSD of intensity within facets ranged from 2.6% to 26%, which indicated that some facets have significant internal nonuniformities. On average, there was an 11% RSD of intensity within a facet. Comparing the mean intensities between all facets, there was an 8.6% RSD between facets (the value was calculated as an average irradiance for each facet). This suggests that localized variations in facet reflectivity have a more significant effect on image non-uniformity than overall facet-to-facet variation.
4.2 Light Throughput
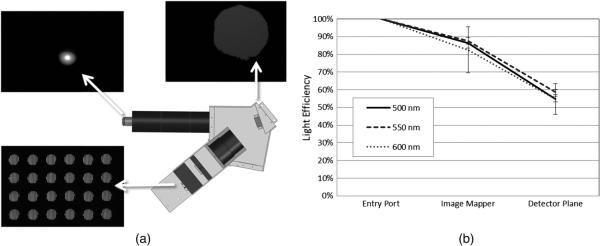
The next test for the IMS system was to measure optical efficiency of the system, defined as the ratio of light entering the system to light recorded on the detector. To examine throughput of the IMS, an iris was placed at the sample plane of a microscope and illuminated with narrowband light at three wavelengths. By moving the IMS's CCD detector, light levels were captured at three locations in the system: at the side port of the microscope, at the mapping mirror, and at the IMS detector plane. The light intensity and integration time were kept constant throughout the experiment, such that the CCD was below saturation at each location; also, the extent of the field was limited so that the entire sample was captured on the CCD. Light intensity at each location was determined by summing all pixels on the CCD after a background subtraction.
Figure 7(a) illustrates the experimental setup and example imaging results from one wavelength test. Complete results are graphed in Fig. 7(b). We measured the relay arm to have 89% throughput, which includes an objective, tube lens, and spectral filters. The redirecting and dispersing optics of the system are ~65% light efficient, which corresponds to a total light efficiency of 58%.
Fig. 7.
Light throughput test. (a) The three locations measured using a large-format CCD. (b) A graph of the overall intensity at each location, plotted for three different wavelengths.
4.3 Scattered Light
Scattered light is defined as any light that reaches the detector other than that defined by the optical system design. In general, scattered light originates from diffuse reflection and back-reflection off optical surfaces. As light passes through a surface, a small amount of scatter occurs that can appear as background in the image, thus reducing contrast and signal-to-noise ratio. Devices with a large number of elements such as the IMS can be more prone to effects related to scattered light. In the IMS, light from the sample passes more than 20 surfaces, including the image mapper, prism array, and lens array. To assess whether this significantly affects image quality, scattered light was measured in an IMS datacube as well as in a digital image from a standard scientific grade CCD camera (Qimaging RetigaEXi) placed at the microscope side port.
In order to measure scattered light, an approximation was made about the Ronchi ruling images: the center of the dark regions should be exactly zero (although, in reality the contrast is not exactly 100% at this spatial frequency; therefore, this is a conservative approach for the measurement). Any loss of contrast within dark regions of the Ronchi images were assumed to be from scattered light. For the IMS data, each of the Ronchi ruling datacubes (0 deg, 45 deg, and 90 deg) were first flat-field corrected according to the calibration procedure and then background-subtracted to reduce the effect of dark current. Each spectral image was segmented into three groups: a “high” group that contained pixels with normalized intensity greater than 0.75, a “low” group normalized intensity less than 0.25, and other. Next, the sum of low intensity regions was calculated and divided by the high intensity regions. The resulting “mean scatter” value was found for each spectral image independently to produce a vector of scatter versus wavelength (see Fig. 8). The average scattered light over all wavelengths and all Ronchi ruling orientations was 9.79%. The same procedure was repeated for flat-field, background, and Ronchi ruling images acquired with the standard CCD camera placed at the side port of the microscope. In this case, we measured the mean scatter to be 6.81%. This suggests the microscope system and/or the Ronchi ruling is responsible for the majority of scatter. Therefore, the IMS recorded spectral images with approximately 3% more scattered light than measured by the standard CCD.
Fig. 8.
(a) An image of a Ronchi ruling acquired with a standard CCD camera placed at the side port of a microscope. After background subtraction and flat-fielding, the signal to background ratio was measured to estimate scatter. (b) A similar procedure was repeated for each spectral image of three IMS datacubes; the results are graphed in (c).
4.4 Geometric Error and Stretch
The geometric error distortion causes straight lines in object space to appear curved in the image. Although curvature of facet images is apparent in the raw IMS data (see Fig. 3), the mapping calibration procedure should correct this aberration in the datacube remapping. However, several factors could leave geometric errors in the datacube, such as noise in the calibration data and damaged/missing facet images. In the Ronchi ruling datacubes, these factors could result in distortion-like geometric errors that cause the bar features to appear curved.
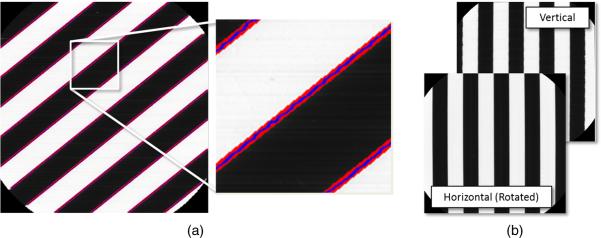
To test the amount of distortion-like geometric error, the corrected 45-deg datacube was analyzed. First, a Sobel edge filter was used to identify the edges of bar features in the panchromatic image. For each edge a line was fit and then the coefficient of determination R2 was calculated (see Fig. 9). The average R2 value for the 11 detected edges was 0.999, which indicated there is minimal distortion in reconstructed IMS images.
| (3) |
We also checked for any difference in magnification between the x- and y-directions of the datacube. Such an anamorphic magnification can stem from errors in the mapping calibration. To check for this error, estimates for the widths of the Ronchi ruling bars in the two orthogonal directions were calculated. First, the datacubes were aligned to the vertical axis. A stretch factor was defined as the normalized ratio between the two measured widths w.
Fig. 9.
(a) The geometric error test was used to look for distortion-like curvature in the image as well as jagged edges. The blue lines represent the edge of the bar feature and the red is the first-order fitted line. (b) The widths of bar features were calculated for panchromatic images of the horizontal and vertical Ronchi ruling.
The widths were measured in integer pixel units. In the case of the data shown here, the width estimation for both the 0-and 90-deg rulings were 40 pixels; therefore, the measured stretch was 0%.
4.5 Coregistration Test
To further assess the accuracy of datacube reconstruction, another test was developed to measure the spatial coregistration of spectral images. Problems with spatial coregistration of spectral images could be a result of inaccurate mapping calibration or strong chromatic aberration in the system. Taking the flat-fielded Ronchi ruling datacubes, each spectral image was converted to a binary image using a threshold. The overlap between every thresholded spectral imagewith every other thresholded spectral image was then calculated by summing pixels at each spatial position. A perfect registration was achieved by registering a given spectral image with itself, and this was used as a normalization of the result to give a percentage coregistration. Since this was calculated between every pair of spectral images, the result was a matrix.
Figure 9 shows the three coregistration matrices obtained from the test and their mean coregistration values. The three matrices correspond to the 0 deg, 45 deg, and 90 deg Ronchi images. Diagonal elements were set to zero, and the log of the percentage registration was taken in order to improve visibility of off-diagonal elements. A perfect coregistration of spectral images within a datacube would result in a matrix of zeros. The linear features [dark/bright horizontal and vertical lines seen Fig. 10(a)] in the matrices of measured datacubes indicated that the coregistration was lower or higher for some wavelengths relative to others; or in some cases they revealed individual spectral images that had prominent mapping errors over a few spatial lines. The quantitative result of this test was the mean of all off-diagonal elements, which showed greater than 99% spatial coregistration of all spectral images.
Fig. 10.
Coregistration evaluation results (log scale) indicate the coregistration of spectral images within perpendicular (a), diagonal (b), and parallel (c) Ronchi ruling datacubes. The diagonal elements have been zeroed out to improve visibility of off-diagonal elements. Average coregistration values for these datacubes are 99.62%, 99.58%, and 99.58%, respectively.
4.6 Spectral Resolution
Spectral resolution is the minimum difference between two wavelengths that a device can distinguish. The spectral resolution of the IMS is influenced by the dispersive properties of prisms/lens array in the system and the pixel sampling. It can be roughly estimated by dividing the spectral range by the number of resolvable bands in the IMS. Our system is designed to sample 200 nm over 25 spectral bands, which results in an average spectral resolution of 8 nm.16 The spectral resolution of the IMS, however, varies nonlinearly with wavelength due to nonlinear dispersion of the prisms. It also depends on accurate calibration mapping. Therefore it is important to measure this parameter for several wavelengths throughout the spectral range.
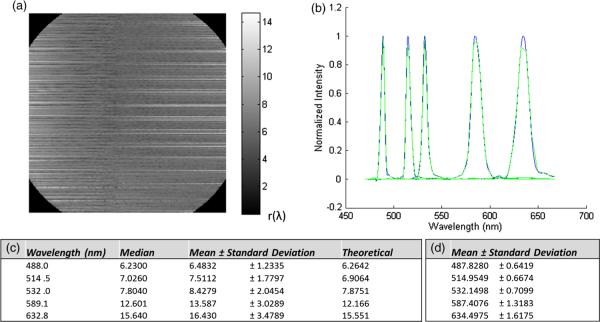
A method for estimating spectral resolution is to measure an object with spectral features smaller than the resolution limit of the system (i.e., a monochromatic source or a lamp with sharp spectral peaks). The convolution of the object with the system response will yield a result that approximates the smallest resolvable feature, measured as the full-width half-maximum (FWHM) of the point spread function (PSF).26 To measure spectral resolution in the IMS, several 1-nm FWHM spectral filters were used to illuminate an empty microscope stage. Spectral resolution was tested at five wavelengths: 488.0, 514.5, 532.0, 589.6, and 632.8 nm.
Figure 11(a) shows a matrix of the measured spectral resolution for the 488.0 nm filter over the field of view, which reveals how resolution varies throughout the field. Periodic variation was most likely influenced by defocus of facet images [for detail, see Fig. 6(a)]. The hardware error that contributes most to this effect is misalignment/tilt of prisms or lenslets within the array. Figure 11(b) shows the representative spectral response to each filter. The green line represents data from the IMS, and the blue line is a spline fit to the IMS data, which was used to estimate the FWHM of the PSF. Figure 11(c) reports the measured and theoretical spectral resolution for each wavelength.
Fig. 11.
(a) The spectral resolution throughout the image shown at 488 nm; grayscale intensity (r) indicates the FWHM of the IMS spectral response. (b) The spectral response at spatial point (150, 150) to each spectral filter; green indicates raw data and blue is the fitted spline. (c) Statistics for spectral resolution at all spatial points in the image. (d) Statistics for spectral accuracy and variability in the image.
4.7 Spectral Accuracy and Variability
Spectral accuracy and variability were first assessed with the five narrowband filters used for spectral resolution tests. The peak location of the fitted spline curve was calculated for each point in the image. Figure 11(d) reports the measured center wavelength of each filter and the standard deviation for these values throughout all IMS spectra. The mean value of IMS spectra falls within 0.1 to 1.7 nm of the nominal peak wavelength for each filter.
The accuracy and precision of IMS spectra were also measured using five standard plastic transmission filters (Roscolux) and an Ocean Optics Spectrometer (OOS USB-4000). Each filter was placed in the illumination path of the microscope, and the transmission spectrum was measured with the IMS and OOS. Each spectrum was divided by the spectrum of the halogen lamp to yield percent transmission. Figure 12 shows the results of three spectral measurements. There was low variability throughout the IMS spectra, with standard deviation 0.5% to 4.5%. IMS spectra closely matched the OOS in the shorter wavelength, but had up to 15% error in the red. The discrepancy is a result of decreased spectral resolution found in the longer wavelengths. Similar behavior is described in other HSI systems, and there is clearly known methodology for correcting this type of error.27,28 The exact correction includes extensive deconvolution procedures, which are out of the scope of this paper. The level of error is acceptable for the relative spectral measurements required in our current applications.19,20
Fig. 12.
Transmission spectra of Roscolux' plastic filters acquired with the IMS and an Ocean Optics Spectrometer. The green line indicates the Ocean Optics Spectrometer results. The red line indicates the mean of IMS spectra at all spatial points with dashes indicating standard deviation.
4.8 Spatial Resolution, Field of View, and Sampling
The IMS differs from most imaging systems because the image mapping mirror, which exists in an intermediate image plane, redirects image strips to separate locations on the detector. The system therefore inherently samples the x- and y-direction differently. In the x-direction, the image is sampled by the discrete number of facets in the image mapper. These facets are projected onto separate locations on the pixel detector, where they are sampled in the y-direction by connected pixels. The remapping calibration then determines subpixel intensity values based on these whole pixels using bicubic interpolation. The first goal of this test was to measure the effective spatial sampling of the IMS.
By design, there are 355(facets) × ~350 samples over the image plane of the IMS datacube. Aberrations introduced by reimaging the image mapping mirror onto the detector can reduce the effective y-sampling to below 350 pixels. Also, an accurate mapping calibration is necessary to sample facet images at the correct locations and sampling rate. By analyzing lookup table data, it was found that facets were sampled by a mean of 340.81 ± 1.21 vertical pixels, which corresponds to 0.97 reconstruction samples/pixel. Therefore, the effective spatial sampling of the IMS is 355 × ~341 integer pixel samples, while the image size is slightly oversampled to 355 × 350 after the mapping calibration.
Given a fixed number of spatial samples, the spatial resolution and FOV of the IMS are primarily dependent on the relay lenses chosen to image the object onto the image mapper. Depending on the desired application, the spatial samples could be used either to maintain a high spatial resolution with small FOV or to acquire a large FOV with low spatial resolution. Diffraction limited performance of the IMS was already discussed in Refs. 17 and 18. Here we present results for qualitative assessment of imaging performance and contrast using a high-resolution 1951 USAF target. The object plane of the IMS was positioned at the Zeiss microscope side port image, which has an NA of 0.01875. A 5× relay objective was used to match two IMS facets to each side port image airy disk diameter. Figure 13 shows a panchromatic image of the target acquired with the 5× relay objective and a 40 × /0.75 NA microscope objective. The Group 9 Element 3 bars are 0.78 μm wide and clearly resolved.
Fig. 13.
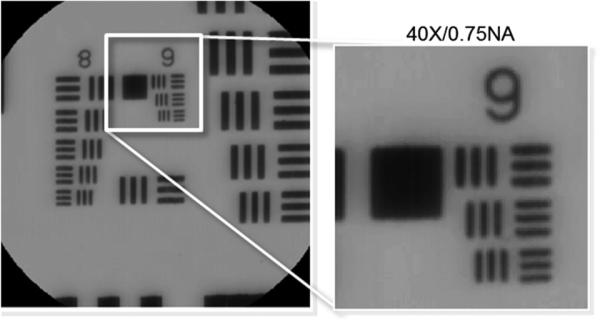
The IMS coupled to a microscope was used to image a high-resolution 1951 USAF target. Panchromatic images are shown. Group 9 Element 3 is 0.78 μm wide.
5 Motion Artifacts and Spectral Linear Unmixing
The tests shown thus far in this paper were used to evaluate the performance limits of the IMS. With an understanding of these limits, experiments can be designed for applications that require a fast and dense spatial/spectral dataset. The IMS system has two powerful capabilities that make it useful for demanding spectral imaging applications: (1) the ability to distinguish objects with similar spectral features, and (2) the ability to record dynamic processes. Here we provide a final qualitative test that evaluates these capabilities.
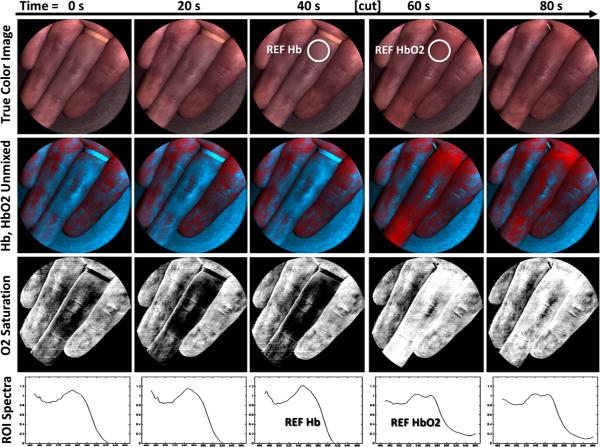
The IMS was used to measure oxygen saturation in vivo during an arterial finger occlusion experiment, following a Rice University IRB-approved normal volunteer protocol. This application particularly benefits from the snapshot capability of IMS because: (1) fast, nonscanning data collection is less susceptible to motion artifacts; and (2) dynamic changes in tissue oxygenation can be recorded and displayed in real-time. With the IMS coupled to a commercial camera lens, images were collected at 7.2 frames per second and 100 ms exposure of a hand illuminated with a white LED (Thorlabs MCWHL2). At the beginning of the experiment one of the fingers underwent total arterial occlusion using a rubber tourniquet. After 1 min the tourniquet was removed and arterial circulation continued. Figure 14 presents spectral imaging results from five different time points. The true color images show the occluded finger becoming slightly pale, then reddish and swollen after blood circulation continued. The “ROI Spectra” shows absorption spectra at each time point, which contain characteristic hemoglobin peaks between 500 and 600 nm. Spectra obtained from a region before and after the occlusion were considered deoxy-hemoglobin (Hb) and oxy-hemoglobin (HbO2) reference spectra, respectively. These spectra contain only slight differences and cannot be quantitatively distinguished with a standard color camera. The IMS, however, can easily differentiate the spectra.
Fig. 14.
To demonstrate the spectral unmixing capability of the IMS for a dynamic application, an arterial finger occlusion experiment was performed.The true color images show the occluded finger becomes pale after 40s without blood flow and then swells with oxygenated blood after the occlusion is removed. Using reference spectra from before and after the occlusion, spectrally unmixed images were created to show distribution of deoxy-hemoglobin (blue) and oxy-hemoglobin (red). Finally, the ratio HbO2/(Hb + HbO2) was calculated for each pixel to reveal relative oxygen saturation in the sample.
Using hemoglobin reference spectra, spectrally unmixed images were created to show the relative distribution of Hb and HbO2 in the hand. Reference 5 describes in general how this linear unmixing is performed. The “unmixed” images depict maps of the relative reference spectra throughout the experiment. Finally, the Hb and HbO2 unmixed images were used to visualize relative oxygen saturation in the tissue, defined as:
| (4) |
These images significantly increase contrast between oxygenated and deoxygenated tissue. Such dynamic measurements can be used to determine vascular function during ischemia and reactive hyperemia.29
Throughout the experiment, movement of the hand had no significant impact on imaging performance. The snapshot nature of the IMS system resulted in images with traditional motion blur seen in standard CCD images, while maintaining coregistered spectral images and accurate spectra, as can be seen in the supplemental movie. Qualitative analyses of results also indicate spectral linear unmixing accurately determined the weighting of reference spectra throughout the experiment. Therefore, this test suggests that the calibrated IMS system is capable of measuring distributions of reference spectra during a dynamic experiment.
6 Discussion and Conclusion
This paper presents the first spatial-spectral calibration and characterization of an image mapping spectrometer. Radio-metric tests indicate that the IMS has high optical throughput (~58%) and negligible scattered light. Geometric calibration results show minimal distortion/stretch and high coregistration, which indicates the raw 2-D detector data is accurately remapped to a datacube. Spectral characterization reveals ~6-nm spectral resolution in the blue wavelength region up to ~16 nm in the red. Although broadband spectral tests show up to 15% error in the red wavelength-region, testing with narrowband light indicates spectral bins are accurate to <2 nm. A high-resolution 1951 USAF target was used to show image quality of the IMS. Finally, an arterial occlusion experiment demonstrated qualitative dynamic imaging performance and spectral unmixing capability. With this new information, a set of specifications now exists to compare this IMS to future IMS devices. These specifications, as well as the description of the tests used to obtain them, is particularly beneficial for end-users to evaluate their systems and design appropriate experiments.
The performance benchmarks presented in this work also provide a means of comparison to different HSI modalities. A discussion of fundamental HSI performance differences is presented in Ref. 30. Here we show quantitative comparison of a few reported specifications for different devices. First, the IMS presented in this paper has much higher optical throughput (~58%) than imaging spectrometers that use tunable spectral filters. LCTF imaging spectrometers, for example, can only collect one wavelength per exposure with typical transmission of only 14% to 30% for randomly polarized visible light.31 On the other hand, pushbroom and whiskbroom imaging spectrometers with fewer optical elements can have much higher transmission, but require a scanning mechanism that can introduce motion artifacts. In terms of spectral resolution, the tested IMS (6 to 16 nm) is comparable to standard LCTF imaging spectrometers (7 to 10 nm),31 as well as airborne devices used for remote sensing and astronomy (10 nm). However, the bandwidth of airborne whiskbroom devices is often much broader than the IMS, spanning the visible and near-infrared (400 to 2500 nm).2
The most appropriate devices to compare the IMS to are other snapshot imaging spectrometers, because these systems have similar operating parameters, such as requiring only a single exposure. A commercialized CTIS imaging spectrometer, with a wavelength range of 400 to 700 nm, reports a spectral resolution of 5 nm and a spectral accuracy of 10%,32 which are similar specifications to those of the IMS. This modality, however, does not have a one-to-one correspondence between the acquired raw data and the final datacube; therefore, it requires increased reconstruction time and has reduced dynamic range in comparison to IMS. Another commercialized imaging spectrometer that does have a one-to-one correspondence is based on field splitting by a lenslet array.15 An implementation of this technology has similar spectral bandwidth (450 to 675 nm) and spectral resolution (11.25 nm) to the IMS, but acquires a much smaller datacube (90 × 75 × 20).33 The performance metrics reported in this paper allow these comparisons and many others to be made for current and future HSI technologies.
Although the evaluation tests here address several aspects of datacube quality, the list is not exhaustive. Future work will implement deconvolution techniques to improve spectral calibration. Finally, the optical design, assembly, and fabrication can be improved as more advanced manufacturing procedures become feasible. As HSI hardware, calibration, and data analysis technologies progress, exciting new applications will become possible.
Supplementary Material
Acknowledgments
The authors would like to thank NIH for its funding support of this project through R01A124319 entitled “Integrated Bi-FOV endoscope for detection of Precancer” and R21EB009186 entitled “Image slicing spectrometer (ISS) for high resolution sub-cellular microscopy.” We would also like to thank Robert Kester and Michal Pawlowski for many useful discussions.
Biographies

Noah Bedard received his BS in biomedical engineering from the University of Texas at Austin in 2006 and his PhD in bioengineering at Rice University in 2012. He is currently a postdoctoral research associate in Tomasz S. Tkaczyk's Modern Optical Instrumentation and Bio-imaging Laboratory at Rice University. His academic interests include spectral imaging, endomicroscopy, and translational research.

Nathan Hagen worked for Thermawave (now KLA Tencor) from 1996 to 2002, as a member of the R&D team developing optical metrology instruments. He graduated with a PhD in optical sciences at the University of Arizona in 2007, studying snapshot imaging spectrometry and spectropolarimetry (including CTIS and CTICS). From 2007 to 2009, he worked as a postdoctoral at Duke University, developing imaging and spectrometry techniques (including CASSI). He joined Rice University as a research scientist in 2009, where he joined the effort to develop the IMS imaging spectrometer and to continue developing new imaging and spectrometry techniques.

Liang Gao received his BS in physics at Tsinghua University in 2005 and his PhD in applied physics at Rice University in 2011. He is currently a postdoctoral research fellow at Washington University in St. Louis in the laboratory of Lihong V. Wang. His research interests include microscopy, optical design and fabrication, and biomedical imaging.

Tomasz S. Tkaczyk is an assistant professor of bioengineering and electrical and computer engineering at Rice University, Houston, Texas, where he develops modern optical instrumentation for biological and medical applications. His primary research is in microscopy, endoscopy, and endo-microscopy, cost-effective high-performance optics for diagnostics, and multidimensional snapshot imaging systems. He received his MS and PhD degrees from the Institute of Micromechanics and Photonics, department of mechatronics, Warsaw University of Technology, Poland. Beginning in 2003, after his postdoctoral training, he worked as a research professor at the College of Optical Sciences, University of Arizona. He joined Rice University in the summer of 2007.
References
- 1.Oke J, et al. The Keck low-resolution imaging spectrometer. Pub.Astro. Soc.Pac. 1995;107:375–385. [Google Scholar]
- 2.Vane G, et al. The airborne visible/infrared imaging spectrometer (AVIRIS) Rem. Sens. Envir. 1993;44:127–143. [Google Scholar]
- 3.Gowen AA, et al. Hyperspectral imaging—an emerging process analytical tool for food quality and safety control. Trends Food Sci. Techn. 2007;18(12):590–598. [Google Scholar]
- 4.Zimmermann T, Rietdorf J, Pepperkok R. Spectral imaging and its applications in live cell microscopy. FEBS Lett. 2003;546(1):87–92. doi: 10.1016/s0014-5793(03)00521-0. [DOI] [PubMed] [Google Scholar]
- 5.Dickinson ME, et al. Multi-spectral imaging and linear unmixing add a whole new dimension to laser scanning fluorescence microscopy. Biotechniques. 2001;31(6):1272–1278. doi: 10.2144/01316bt01. [DOI] [PubMed] [Google Scholar]
- 6.Morris HR, Hoyt CC, Treado PJ. Imaging spectrometers for fluorescence and Raman microscopy: acousto-optic and liquid-crystal-tunable filters. Appl. Spectrosc. 1994;48(7):857–866. [Google Scholar]
- 7.Duarte MF, Baraniuk RG. Kronecker compressive sensing. IEEE Trans. Image Process. 2012;21(2):494–504. doi: 10.1109/TIP.2011.2165289. [DOI] [PubMed] [Google Scholar]
- 8.Ferrec Y, et al. Experimental results from an airborne static Fourier transform imaging spectrometer. Appl. Opt. 2011;50(30):5894–5904. doi: 10.1364/AO.50.005894. [DOI] [PubMed] [Google Scholar]
- 9.Pisani M, Zucco M. Compact imaging spectrometer combining Fourier transform spectroscopy with a Fabry-Perot interferometer. Opt. Express. 2009;17(10):8319–8331. doi: 10.1364/oe.17.008319. [DOI] [PubMed] [Google Scholar]
- 10.Descour M, Dereniak E. Computed-tomography imaging spectrometer: experimental calibration and reconstruction results. Appl. Opt. 1995;34(22):4817–4826. doi: 10.1364/AO.34.004817. [DOI] [PubMed] [Google Scholar]
- 11.Okamoto T, Yamaguchi I. Simultaneous acquisition of spectral image information. Opt. Lett. 1991;16(16):1277–1279. doi: 10.1364/ol.16.001277. [DOI] [PubMed] [Google Scholar]
- 12.Wagadarikar A, et al. Single disperser design for coded aperture snapshot spectral imaging. Appl. Opt. 2008;47(10):B44–B51. doi: 10.1364/ao.47.000b44. [DOI] [PubMed] [Google Scholar]
- 13.VivŁs S, Prieto E. Original image slicer designed for integral field spectroscopy with the near-infrared spectrograph for the James Webb Space Telescope. Opt. Eng. 2006;45(9):093001. [Google Scholar]
- 14.Matsuoka H, et al. Single-cell viability assessment with a novel spec-tro-imaging system. J. Biotechnol. 2002;94(2002):299–308. doi: 10.1016/s0168-1656(01)00431-x. [DOI] [PubMed] [Google Scholar]
- 15.Bodkin A, Sheinis AI, Norton A. Hyperspectral imaging systems. U. S. Patent Ed. 2006 [Google Scholar]
- 16.Gao L, et al. Snapshot image mapping spectrometer (IMS) with high sampling density for hyperspectral microscopy. Opt. Express. 2010;18(14):14330–14344. doi: 10.1364/OE.18.014330. [DOI] [PMC free article] [PubMed] [Google Scholar]
- 17.Gao L, Kester RT, Tkaczyk TS. Compact image slicing spectrometer (ISS) for hyperspectral fluorescence microscopy. Opt. Express. 2009;17(15):12293–12308. doi: 10.1364/oe.17.012293. [DOI] [PMC free article] [PubMed] [Google Scholar]
- 18.Kester RT, Gao L, Tkaczyk TS. Development of image mappers for hyperspectral biomedical imaging applications. Appl. Opt. 2010;49(10):1886–1899. doi: 10.1364/AO.49.001886. [DOI] [PMC free article] [PubMed] [Google Scholar]
- 19.Gao L, et al. Bio-optics: Design and Application. OSA Technical Digest; Monterey, CA: 2011. Real-time hyperspectral imaging of pancreatic β-cell dynamics with Image Mapping Spectrometer (IMS) [Google Scholar]
- 20.Hagen N, et al. Spectrally-resolved imaging of dynamic turbid media. Proc. SPIE. 2011;7892:789206. [Google Scholar]
- 21.Kester RT, et al. Real-time snapshot hyperspectral imaging endo-scope. J. Biomed. Opt. 2011;16(5):056005. doi: 10.1117/1.3574756. [DOI] [PMC free article] [PubMed] [Google Scholar]
- 22.Gao L, et al. Depth-resolved image mapping spectrometer (IMS) with structured illumination. Opt. Express. 2011;19(18):17439–17452. doi: 10.1364/OE.19.017439. [DOI] [PMC free article] [PubMed] [Google Scholar]
- 23.Soille P. Morphological Image Analysis: Principles and Applications. Springer; New York, NY: 1999. [Google Scholar]
- 24.Keys R. Cubic convolution interpolation for digital image processing. Acoustics, Speech and Sig. Proc., IEEE Trans. 1981;29(6):1153–1160. [Google Scholar]
- 25.Seibert J, Boone J, Lindfors K. Flat-field correction technique for digital detectors. Proc. SPIE. 1998;3336:348–354. [Google Scholar]
- 26.Gomez R. Hyperspectral imaging: a useful technology for transportation analysis. Opt. Eng. 2002;41(09):2137–2143. [Google Scholar]
- 27.Burmen M, Pernus F, Likar B. Spectral characterization of near-infrared acousto-optic tunable filter (AOTF) hyperspectral imaging systems using standard calibration materials. Appl. Spectrosc. 2011;65(4):393–401. doi: 10.1366/10-05987. [DOI] [PubMed] [Google Scholar]
- 28.Katrašnik J, Pernuš F, Likar B. Deconvolution in acousto-optical tunable filter spectrometry. Appl. Spectrosc. 2010;64(11):1265–1273. doi: 10.1366/000370210793334945. [DOI] [PubMed] [Google Scholar]
- 29.Zuzak KJ, et al. Visible reflectance hyperspectral imaging: characterization of a noninvasive, in vivo system for determining tissue perfusion. Anal. Chem. 2002;74(9):2021–2028. doi: 10.1021/ac011275f. [DOI] [PubMed] [Google Scholar]
- 30.Hagen N, et al. Snapshot advantage: a review of the light collection improvement for parallel high-dimensional measurement systems. Opt. Eng. 2012;51(11):111702. doi: 10.1117/1.OE.51.11.111702. [DOI] [PMC free article] [PubMed] [Google Scholar]
- 31.VariSpec liquid tunable crystal filters. Caliper LifeSciences; Hopkinton, MA: [Google Scholar]
- 32.Verde™ hyperspectral imaging cameram. Horiba Scientific; Edison, NJ: [Google Scholar]
- 33.VNIR-20B video rate hyperspectral imager. Bodkin Design & Engineering; Newton, MA: 2012. [Google Scholar]
Associated Data
This section collects any data citations, data availability statements, or supplementary materials included in this article.


