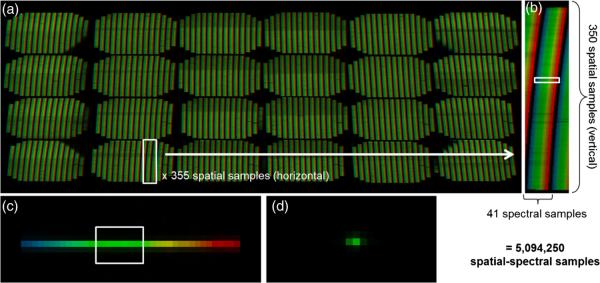
Fig. 3.
The IMS detector response to different spatial and spectral samples. (a) Detector response to uniform sample illuminated with white light (false-colored to illustrate spectral content). (b) Close-up of one dispersed facet image, which corresponds to the spatial-spectral information of one line in the object. (C) Response to spatial pointsource (i.e. a pinhole) illuminated with white light. (d) Response to a spatial pointsource illuminated with narrowband (550/1 nm) light.

