Abstract
The effects of vascular rarefaction (the loss of small arteries) on the circulation of blood are studied using a multiscale mathematical model that can predict blood flow and pressure in the systemic and pulmonary arteries. We augmented a model originally developed for the systemic arteries (Olufsen et al. 1998, 1999, 2000, 2004) to (a) predict flow and pressure in the pulmonary arteries, and (b) predict pressure propagation along the small arteries in the vascular beds. The systemic and pulmonary arteries are modelled as separate, bifurcating trees of compliant and tapering vessels. Each tree is divided into two parts representing the `large' and `small' arteries. Blood flow and pressure in the large arteries are predicted using a nonlinear cross-sectional area-averaged model for a Newtonian fluid in an elastic tube with inflow obtained from magnetic resonance measurements. Each terminal vessel within the network of the large arteries is coupled to a vascular bed of small `resistance' arteries, which are modelled as asymmetric structured trees with specified area and asymmetry ratios between the parent and daughter arteries. For the systemic circulation, each structured tree represents a specific vascular bed corresponding to major organs and limbs. For the pulmonary circulation, there are four vascular beds supplied by the interlobar arteries. This manuscript presents the first theoretical calculations of the propagation of the pressure and flow waves along systemic and pulmonary large and small arteries. Results for all networks were in agreement with published observations. Two studies were done with this model. First, we showed how rarefaction can be modelled by pruning the tree of arteries in the microvascular system. This was done by modulating parameters used for designing the structured trees. Results showed that rarefaction leads to increased mean and decreased pulse pressure in the large arteries. Second, we investigated the impact of decreasing vessel compliance in both large and small arteries. Results showed, that the effects of decreased compliance in the large arteries far outweigh the effects observed when decreasing the compliance of the small arteries. We further showed that a decrease of compliance in the large arteries results in pressure increases consistent with observations of isolated systolic hypertension, as occurs in ageing.
Keywords: Multiscale cardiovascular model, arterial rarefaction, blood pressure dynamics, resistance arteries, hypertension
1. Introduction
Predictions of blood flow and pressure in the vascular beds of small, `resistance arteries' of diameters between approximately 100 and 300 μm (Christensen & Mulvaney 2001) are important, since these vessels has a significant impact on pressure and flow in the large arteries. In particular, analysis of flow and pressure in these vessels is important for understanding the effects of vascular rarefaction, which is associated with essential systemic and pulmonary hypertension. Rarefaction is a reduction in the density of small arterioles and capillaries Hopkins & McLoughlin (2002). The effects of rarefaction have been studied experimentally in animals (Greene et al. 1989; Noble et al. 1990; Hudetz 1993). These studies have shown that microvascular rarefaction contributes to an increase in vascular resistance, which, together with stiffening of the arteries, are the main contributors to hypertension. Several authors have shown that rarefaction is associated with structural absence of capillaries and arterioles, rather than with non-perfusion in existing vessels (Antonios 2006). However, it is still uncertain if microvascular rarefaction occurs before the blood pressure becomes abnormal, or if blood pressure becomes abnormal due to rarefaction. In the clinical literature, this question is discussed in patients with borderline hypertension. Most recent studies (Antonios et al. 1999, 2003) indicate that rarefaction comes first, and that abnormal blood pressure is a consequence. In addition to essential hypertension, rarefaction is also associated with chronic lung-disease (Hopkins & McLoughlin 2002), whereas modelling of the arterial walls of the resistance vessels leads to an increased vascular resistance. For this pathology, the outstanding question is if both factors are necessary for development of chronic lung disease.
In this study, we develop a multiscale mathematical model that allows prediction of blood pressure and flow in both large and small arteries. Many models have been developed for the prediction of blood flow and pressure in the large arteries, but to our knowledge no previous studies have addressed prediction of pressure in the small resistance arteries. For this study, we use our previous model (Olufsen et al. 1998, 1999, 2000, 2004) as a point of departure, and modify it to predict flow and pressure in both large and small arteries. In addition, for the pulmonary vasculature, the model is redesigned to account for higher compliance and lower pressure. Each terminal vessel within the network of large arteries is coupled to a vascular bed of small resistance arteries that are modelled as asymmetric, structured trees with specified area and asymmetry ratios between the parent and daughter arteries. For the systemic circulation, each structured tree represents a specific vascular bed corresponding to major organs and limbs. For the pulmonary circulation, there are four vascular beds supplied by the interlobar arteries. Originally, the resistance arteries were used only to provide a physiologically-based outflow boundary condition for the large arteries. In this study, we show how the boundary condition model can be transformed to predict pressure and flow along each vessel in the microvasculature.
The multiscale model developed in this study employs a nonlinear one-dimensional model to predict arterial blood flow and pressure via solution of the Navier–Stokes equations for a Newtonian fluid. For the vessels in the vascular beds, blood pressures are predicted via solution of a linearized model. The model for the large arteries uses measured cardiac outflow as the input into the root arteries (the aorta and the main pulmonary artery) and describes pressure and flow propagation along the vessels. The model assumes explicit information about the geometry (length and radii) of each of the large vessels. The geometry of the vascular beds is not explicitly defined for each vessel, but instead vessels are defined via a self-similar structured tree. For this study, the aortic and main pulmonary arterial blood flow as well as explicit geometry (length and diameters) of the large vessels were obtained from magnetic resonance imaging (MRI) data, while the geometry and compliance of the microvasculature were estimated from literature data. Finally, the model was adapted to study vascular rarefaction and the effect of changed compliance on pressure and flow.
2. Methods
Our objective is to develop a model predicting flow and pressure in the large and small systemic and pulmonary arteries shown in Figure 1. For both the large and small arteries, we first describe the geometry used for generating the domain for the computational models. Secondly we discuss how the fluid dynamics is treated within both structures. Finally, we discuss how rarefaction can be modelled via geometric changes to the structured trees representing the small arteries.
Figure 1.

Schematic of the large pulmonary (top) and systemic (bottom) arteries used in the mathematical model.
2.1. The large arteries
2.1.1. Vessel geometry
For the systemic arteries, we used the geometry described in previous studies (Olufsen et al. (2000)), while for the pulmonary arteries we used MRI measurements from a healthy young volunteer obtained by our collaborators at the Scottish Pulmonary Vascular Unit. The cardiac magnetic resonance imaging was performed on a 1.5T Sonata MRI scanner (Siemens Medical Solutions, Erlangen, Germany) with simultaneous electrocardiography (ECG) recording. Pulmonary artery flow was measured using MRI phase-contrast flow quantification in an image plane positioned perpendicular to the main pulmonary artery, at least 1 cm distal to the pulmonary valve. A velocity encoded k-space segmented gradient-echo sequence was used (imaging parameters were echo time = 3.1 ms, repetition time = 16 ms, flip angle = 15°, slice thickness = 6 mm, temporal resolution = `limited by TR', image matrix = 256, field of view = 380 mm, in-plane resolution = 1.9 mm × 1.5 mm, velocity encoding range = 1.5 ms−1) to generate 45 matched pairs of anatomical and velocity images. Retrospective ECG-gating was used to ensure coverage of the complete cardiac cycle. The subject was instructed to breathe freely throughout this section of the protocol. The time of acquisition was approximately 3 minutes adjusted to the subject's heart rate. The cardiac magnetic resonance images were analysed by a single operator using the Argus analysis software (Siemens, Erlangen, Germany).
For both systems, the network is assumed to consist of bifurcating vessels that taper exponentially along their length Olufsen (1998). For each vessel, geometric data specified in Table 1, include the vessel length as well as diameters from both the proximal and distal end of the vessel. For the large systemic arteries, all major bifurcations are included, while for the large pulmonary arteries, we include the left and right main pulmonary arteries, followed by one additional bifurcation. The networks of arteries for both models are shown in Figure 1. The pulmonary vessels in the second generation (numbered 4 and 6 in Figure 1) are too small for accurate measurement of both proximal and distal diameters as well as their length. However, these vessels are short (5 mm) and fairly straight. Therefore we assume that the vessels are non-tapering, and we let the proximal radius equal the distal measured radius. At each bifurcation the radius at the distal end of any parent vessel is larger than that at the entrance to either of the daughter vessels, while the sum of the cross-sectional areas of the two daughter vessels is greater than the area of the parent vessel. Consequently, the total cross-sectional area increases at each bifurcation. The tapering of the individual vessels follows an exponential curve of the form
| (2.1) |
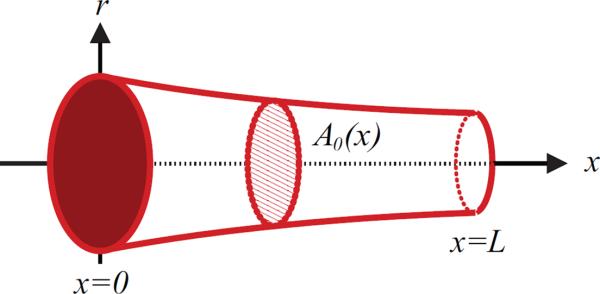
where k = log(rdist/rprox)/L is the tapering factor, rprox and rdist are the radii at the proximal (inlet) and distal (outlet) ends of the vessel, L denotes the vessel length, and x is the location along the artery. Thus, to describe the geometry of the large arteries, the proximal (x = 0) and distal (x = L) radii, as well as the length of each vessel, are required.
Table 1.
Dimensions of the large vessels of the systemic (top) and pulmonary (bottom) arteries. The lengths of all vessels are rounded to the nearest 0.25 cm to match the spatial resolution used in the numerical computations. Data for the systemic vessels are from measurements reported in (Olufsen et al. 2000) while data for the pulmonary vessels are from experiments done in this study.
| No. | Name | Inlet diam. (cm) | Outlet diam. (cm) | Length (cm) |
|---|---|---|---|---|
| 1 | Ascending aorta | 1.25 | 1.14 | 7.0 |
| 5 | Aortic arch | 1.14 | 1.11 | 1.8 |
| 7 | Aortic arch | 1.11 | 1.09 | 1.0 |
| 9 | Thoracic aorta | 1.09 | 0.85 | 18.8 |
| 11 | Abdominal aorta | 0.85 | 0.83 | 2.0 |
| 13 | Abdominal aorta | 0.83 | 0.80 | 2.0 |
| 15 | Abdominal aorta | 0.80 | 0.79 | 1.0 |
| 17 | Abdominal aorta | 0.79 | 0.73 | 6.0 |
| 19 | Abdominal aorta | 0.73 | 0.70 | 3.0 |
| 20 | External iliac | 0.45 | 0.43 | 6.5 |
| 21 | Femoral | 0.43 | 0.40 | 13.0 |
| 24 | Femoral | 0.40 | 0.30 | 44.0 |
| 22 | Internal iliac | 0.20 | 0.20 | 4.5 |
| 23 | Deep femoral | 0.20 | 0.20 | 11.0 |
| 2 | Anonyma | 0.70 | 0.70 | 3.5 |
| 3, 8 | Subcl. and brach. | 0.44 | 0.28 | 43.0 |
| 4 | R. com. carotid | 0.29 | 0.28 | 17.0 |
| 6 | L. com. carotid | 0.29 | 0.28 | 19.0 |
| 10 | Celiac axis | 0.33 | 0.30 | 3.0 |
| 12 | Sup. mesenteric | 0.33 | 0.33 | 5.0 |
| 14, 16 | Renal | 0.28 | 0.25 | 3.0 |
| 18 | Inf. mesenteric | 0.20 | 0.18 | 4.0 |
|
| ||||
| 1 | Main pulm. | 2.72 | 2.60 | 4.50 |
| 2 | R. pulm. | 1.85 | 1.21 | 5.75 |
| 3 | L. pulm. | 2.21 | 2.16 | 2.50 |
| 4 | R. interlobar | 1.14 | 1.10 | 1.25 |
| 5 | - | 0.93 | 0.93 | 0.50 |
| 6 | L. interlobar | 2.08 | 1.81 | 2.25 |
| 7 | - | 1.16 | 1.16 | 0.50 |
2.1.2. Fluid dynamics
Similar to previous studies (Olufsen et al. 1998, 1999, 2000, 2004) for each vessel, the flow and pressure were obtained by solving the one-dimensional Navier–Stokes equations defined by two equations ensuring conservation of volume and momentum, and a third equation of state, relating pressure and cross-sectional area. The conservation of volume and momentum equations are given by
| (2.2) |
where q(x, t) denotes the volumetric flow rate, A(x, t) is cross-sectional area, ρ is the density of the blood, p(x, t) is the pressure, ν is kinematic viscosity, δ is boundary layer thickness, r(x) is the radius of the given vessel, x is distance along the vessel, and t is time.
These equations are obtained by assuming a flat velocity profile with a thin boundary layer of the form
| (2.3) |
where R is the radial coordinate. Finally, the state equation is derived assuming that the arterial wall can be represented by a thin elastic shell. This assumption leads to
| (2.4) |
where p0 is the external pressure, E is Young's modulus, h is the vessel wall thickness, and r0(x) is vessel radius when p = p0, corresponding to r0, the unstressed vessel area . Throughout this paper, we assume that p0 is constant, which we take to be zero. This value was chosen, since data were measured (using MRI) from subjects resting in supine position.
For the systemic arteries, we assume that the vessel stiffness (the inverse of vascular compliance) varies with radius, i.e.
where k1 = 1.50 × 10⁴ mmHg, k2 = −25.5 cm−1 and k3 = 349 mmHg are parameters.
One of the major differences between the pulmonary and systemic arteries is that pressure in the pulmonary arteries is significantly lower than in the systemic arteries; the systemic arteries have a mean pressure of approximately 100 mmHg, while the mean pressure in the pulmonary arteries is closer to 15 mmHg. (We follow clinical practice and use mmHg (1 mmHg = 133.32 Pa) as the unit of pressure for ease of comparison with physiological data.) This difference in pressure is reflected in the properties of the right ventricle, which generates the pressure wave that is pumped into the pulmonary arteries, as well as the properties of the pulmonary arterial wall. In this study, we do not model the heart explicitly, but focus on understanding how to predict the stiffness of the arterial wall Eh/r0 for the pulmonary arteries. To do so, we utilize results of Krenz & Dawson (2003), who summarized the distensibility of the pulmonary arteries, using data from 26 studies within 6 different species. These data were used to specify the distensibility of the vessels in terms of the distensibility parameter, ∊, defined by
| (2.5) |
They further showed, across all studies, that ∊ ≈ 0.02 mmHg−1. We adopted this value for both the large (described here) and the small pulmonary arteries described in the next section. To relate Eh/r0 to ∊, note that, for small values of the transmural pressure p – p0, equation (2.4) implies that
Comparison with (2.5) gives
| (2.6) |
Consequently, for the pulmonary vessels, we use Eh/r0 = 34.5 mmHg, irrespective of vessel radius.
The fluid dynamics equations listed above are hyperbolic, hence two boundary conditions are needed for each vessel (for details see Olufsen 1998, 1999). We separate the large vessels in the vascular networks into three types, those that lead to a bifurcation (e.g. vessels 7, 9, or 20 in the arterial network, or vessels 2 and 3 in the pulmonary network), the root vessel, and terminal vessels. Each network contains one root vessel, the aorta (in the systemic arterial network) and the main pulmonary artery (in the pulmonary arterial network). Inflows into these two vessels are specified from measurements. Terminal vessels (e.g. vessels 3, 8, or 23 in the arterial network, and vessels 4 and 6 in the pulmonary network) are linked to the networks of small vessels. Below we describe these three types of boundary conditions.
For the systemic arteries, the inflow into the network is taken from measurements reported in (Olufsen et al. 2000), while for the pulmonary artery we used data from the MRI measurements as described above in Section (2.1.1) (see Figure 3). For these studies, the flow was measured at 45 equally spaced time points over the period of one heart beat. Similar to the previous work for the systemic arteries, inflow data for the pulmonary circulation was interpolated at the time-resolution required for the numerical algorithm used for solving the fluid dynamics equations. Details of the numerical solver can be found in Olufsen et al. (2000). Boundary conditions need to be applied at two locations, proximally in vessels coupled to the microcirculation and at vessel bifurcations. At vessel bifurcations, flow is conserved and we assume that pressure is continuous, i.e. we enforce
| (2.7) |
| (2.8) |
where xL denotes the last point in the parent vessel and x0 the first point in each of the two daughter vessels, respectively.
Figure 3.
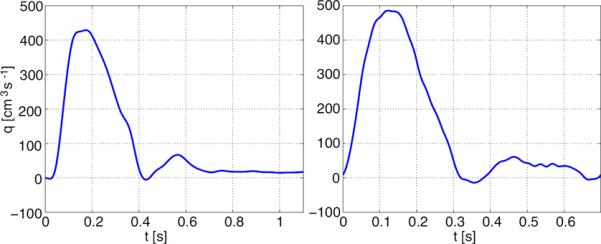
Inflow profiles for the aorta (left) and main pulmonary artery (right). The data are for two different individuals so that the periods are not the same. The profiles were interpolated from MRI measurements sampled at 32 (aorta) and 45 (pulmonary artery) points per period.
Terminal boundary conditions are applied where the large artery model is linked to the vascular beds. Since the inflow boundary condition is periodic, the flow and pressure can be expressed using Fourier series given by
| (2.9) |
where ωk = 2πk/T is the angular frequency, T is the period and
| (2.10) |
Note that the terminology used here is analogous to electrical networks, with P playing the role of voltage and Q the role of current. Given the above definitions for flow and pressure, for each Fourier mode, the frequency-dependent impedance Z(x, ωk) can be defined as
Next, given Z(x, ωk), the impedance z(x, t) can be found from
From the convolution theorem, we obtain the following relation between p and q:
| (2.11) |
which is applied at the terminal vessels (Olufsen et al. 1998, 1999, 2000, 2004) Values for Z(x, ωk) are found as the input impedance of a structured tree of small arteries, as described in the following section.
2.2. The small arteries
The small arteries of the vascular bed are distributed to ensure that all muscles and organs are perfused sufficiently with blood. Similarly to the large arteries, the small arteries (in this category we include vessels with radii greater than 50 – 100 μm), mostly bifurcate (Caro 1978), while capillaries (not modelled here) form a mesh rather than a tree. As discussed above, a tree of small arteries is associated with each of the terminal vessels in the network of large arteries. In the tree of small vessels, we also predict flow and pressure, but use a simplified model. As in previous studies (Olufsen et al. 1999, 2000) we describe branching of the small arteries using a structured bifurcating tree, where at each bifurcation, the radii of the daughter vessels are scaled with factors α and β, respectively. Below we summarize geometric properties for the tree of small vessels, describe the fluid dynamics equations solved in these vessels, and discuss how to model rarefaction.
2.2.1. Vessel geometry
A tree of small arteries is associated with each of the terminal vessels in the network of large arteries. This tree follows the structure described previously (Olufsen et al. 1999, 2000) where at each bifurcation a parent artery with radius r0 divides into two daughter arteries of radii αr0 and βr0 (see Figure 4). The factors α and β are defined such that the cross-sectional area of each daughter vessel is smaller than the area of the parent vessel, while the sum of areas of the two daughter vessels is larger than that of the parent vessel. A recent study carried out in collaboration with Steele et al. (2007) showed that scaling properties may be functions of the radius, and these functions may be organ specific. In this study, we concentrate on the differences between systemic and pulmonary arteries, and use constant scaling throughout each of the vascular beds. The focus of this study is to understand impact of rarefaction, which is studied through variation of the scaling parameters.
Figure 4.
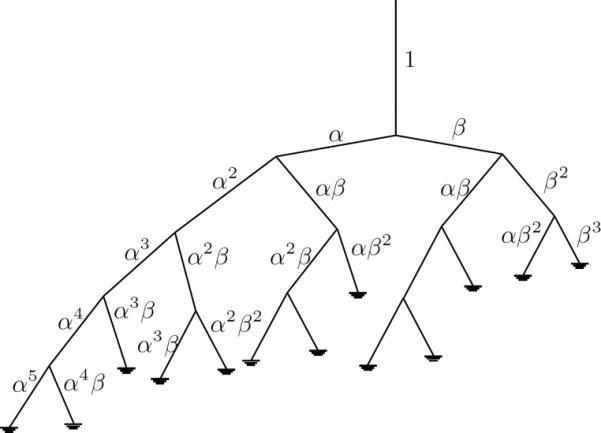
The structured tree of small vessels showing scaling factors.
The assumptions noted above, can be formulated using three quantities: a radius relation, an asymmetry ratio, and an area ratio given by
As in previous studies (Olufsen 1999), for both the systemic and the pulmonary trees, we let ξ = 2.76, η = 1.16, and γ = 0.41, and we assume that vessels in the systemic vascular beds terminate wherever the vessel radii are less than a given minimum radius, rmin. Systemic trees are terminated when r < 100 μm and pulmonary trees are terminated when r < 50 μm. It should be noted that these networks do not account for variation with the branching angle. The base values listed above will be modified to predict dynamics in individuals with rarefaction, who have fewer and smaller calibre blood vessels in any given volume of tissue. We model rarefaction by decreasing the value of the area ratio, η, the dependent variable, which can be imposed by decreasing the independent variables ξ and γ. The result is a structured tree with fewer generations. This is discussed in greater detail in Section 3.2.
The remaining geometric property, is the vessel length, which is assumed to vary linearly with the vessel radius. For the systemic arteries we set the length to radius ratio lrr = 50 as suggested by Iberall (1967). However, the relation length and radius is significantly different in the pulmonary arteries. Data collated by Fung (1996) (based on studies by Singhal et al. (1973)) and by Huang et al. (1996) show that the length of arterial vessel segments, compared with their radii, are considerably shorter in the pulmonary circulation (lrr ~ 10 – 20).
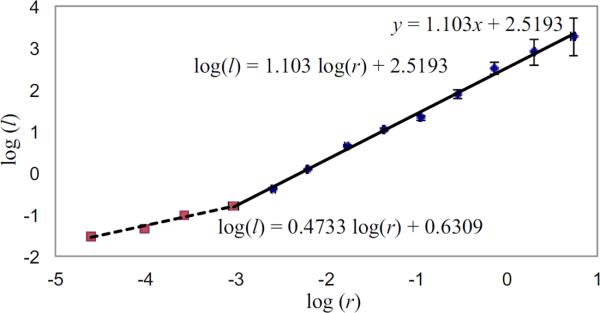
Figure 5 shows a log-log plot of data from Huang et al. (1996) of pulmonary arterial length as a function of vessel radius. The points represent the averaged lengths and radii for each of 15 orders of the pulmonary tree, as described by the diameter-defined Strahler ordering model (see Vaughan (2010)). Note, the relation between the log(vessel length) and the log(vessel radius) is linear. The values obtained using least squares fitting are shown on the graph. Given this evidence that there is a structural change in the length to radius ratio, the radius of the terminal vessels in the pulmonary tree was taken to be 0.05 mm for all runs. Consequently, we assume that lrr remains constant throughout the pulmonary structured tree and that
| (2.12) |
where l and r are measured in mm.
Figure 5.
Log-log plots of the vessel radius (r in mm) versus length (l in mm) for pulmonary arteries, using data from Huang et al. (1996). The two lines are fitted using the method of least squares, and show that different scalings apply for r < 0.05 mm (Strahler orders 1 to 4) and r > 0.05 mm (Strahler orders 4 to 12).
2.2.2. Fluid dynamics
The motion of the fluid in each small vessel in the structured tree is approximated by the flow in a long, straight, axisymmetric vessel which is governed by the axisymmetric Navier–Stokes equations. We use this approximation because the Reynolds numbers are sufficiently small that the flows are fully-developed over most of the length of these vessels. The equations are then linearized assuming that the amplitude of the change in the cross-sectional area is small. The linearized model was derived by balancing internal and external forces acting on the vessel wall. The important forces for this system include internal forces acting directly on the vessel wall and external forces induced by inertia, tethering, and surface forces. The interaction between the fluid and the wall is obtained using the no-slip condition, ensuring that the velocity of the fluid at the wall, in both radial and longitudinal directions, is balanced by the corresponding movement of the wall. This approach follows that of Pedley (1980) based on the original derivation by Atabek & Lew (1966); Atabek (1968). As is the case for the large vessels, since the pulse is periodic, the flow and pressure can be expressed using Fourier series as in (2.9) and (2.10). The resulting equations predict the conservation of volume and momentum for each frequency ωk, given by
| (2.13) |
| (2.14) |
where Q(x, ωk) denotes the volumetric flow and P(x, ωk) denotes the pressure, both of which are formulated in the frequency domain. The compliance C is approximated by differentiation and linearization of the state equation (2.4) for the large arteries, i.e.
which applies since Eh ≫ pr0. The term FJ is a function of the Womersley parameter w given by
These equations are periodic with period T (the length of the cardiac cycle) and apply to any vessel of length L. By inserting the derivative of (2.13) into (2.14) gives
Solution of the above equation gives
| (2.15) |
where P is obtained by inserting the solution for Q into (2.13). Note, a and b are arbitrary constants of integration. For any Fourier mode, the impedance is defined as
and hence
| (2.16) |
At each end of the vessel (i.e. at x = 0 and x = L), the impedance can be computed using (2.16), from which the root impedance for any vessel can be found as
| (2.17) |
For any vessel, the input impedance for zero frequency is given by
| (2.18) |
where lrr = L/r0 is the length to radius ratio. Equation (2.18) suggests that in general, for any network, the root impedance will be proportional to . Since the structured tree is terminated when the radii of the leaves are smaller than some given minimum value r < rmin, the constant of proportionality can not be derived analytically.
The above equations give expressions for impedance; in addition we want to predict flow and pressure along the structured tree, so we start by non-dimensionalizing (2.16) using
| (2.19) |
where pc is the characteristic pressure and qc is the characteristic flow. Using these, the non-dimensional impedance becomes
| (2.20) |
At the proximal end of a vessel, i.e. at x = 0, the flow and pressure can be written as
| (2.21) |
The constants a and b can be written in terms of the non-dimensional flow and pressure giving
| (2.22) |
By substituting for the constants a and b in (2.15), the non-dimensional pressure at the distal end of a vessel can be determined in terms of the non-dimensional flow and pressure at the proximal end of the vessel,
| (2.23) |
Similarly, the non-dimensional flow at the end of a vessel can be determined via its relationship with pressure and impedance, as
| (2.24) |
2.2.3. Pressure
As mentioned previously, the pressure drop in the systemic arteries occurs mostly across the smaller resistance arteries (Levy et al. 2001; Pries et al. 1995). While our previous model (Olufsen et al. 1999, 2000, 2004) takes into account the effect of the smaller arteries on the flow and pressure of the large arteries, the flow and pressure in the smaller arteries was not explicitly determined. We have developed a new method to calculate the pressure pulse in the small resistance arteries, without losing the overall efficiency of the original model.
In the following, we denote pressure, flow and impedance at the end of the root vessel as
and the pressure, flow and impedance at the proximal and distal ends of a generic vessel of the structured tree, that has been scaled by a factor αnβm with respect to the root vessel, as
Continuity of pressure is imposed across bifurcations so that the pressure at the proximal end of vessel α, , is the same as the pressure at the distal end of its parent vessel, . Furthermore, the flow at the proximal end of vessel α, , can be found from the pressure, , and the impedance, , at that point, from
| (2.25) |
Knowing the flow and pressure, and impedance at the proximal end of vessel α, equation (2.23) allows us to determine the flow and pressure at the distal end of that vessel,
| (2.26) |
| (2.27) |
An identical argument can be applied to vessels scaled by β.
In the following, we refer to the succession of vessels scaled by a factor α from their parent vessel as the α-branch, while vessels scaled by β are referred to as the β-branch. Since α > β, the α-branch represents the longest possible route from the root to the structured tree, while the β-branch denote the shortest possible route from the root of the structured tree. The pressure at the distal end of any vessel in the α-branch can be found as
| (2.28) |
The pressure at the proximal end of the vessel is the same as the pressure at the distal end of its parent vessel, and the corresponding flow can be determined from the pressure and the impedance, i.e.
| (2.29) |
Thus, for any vessel in the α-branch,
| (2.30) |
Using this expression, the pressure at the distal end of any vessel can be found directly from the pressure at the proximal of the root vessel and the impedances at the proximal end of each vessel in the structured tree. This allows us to calculate the pressure (and, through its relation with the impedance, the flow) in any vessel along the α-branch, without losing the numerical efficiency of the original impedance model.
Algorithm for determining pressures in the α-branch
Read proximal pressure from file (in time domain).
- Transform to (frequency domain) by
- For each frequency:
-
◯Compute and store distal impedances for each vessel in the tree, using the algorithm described in Olufsen et al. (2000).
- ◯
-
◯
- Transform to (time domain) by
By an identical argument, it is possible to determine the pressures (and flows) in any generation of the β-branch by,
.
2.2.4. Self-similarity in the structured tree
The composition of the structured tree is such that it is possible to have more than one vessel that has been scaled by the same factor, with respect to the root vessel, but have different parent vessels. For example, vessels scaled by αβ (parent vessel α) and those scaled by βα (parent vessel β) will have identical physical characteristics (length, radius), but because they have different parentage, the pressures in these vessels will be different. Despite this, it is still possible to find a relation between the pressures in these vessels. For example, for the vessel scaled by αβ,
| (2.31) |
| (2.32) |
and for vessel βα,
| (2.33) |
. This gives the similarity relations
| (2.34) |
, which hold since , , and .
3. Results
We first show results of predicting pressure and flow in representative large and small vessels, then we discuss the impact of rarefaction, and of changing vascular compliance.
3.1. Pressure and flow in the large and small arteries
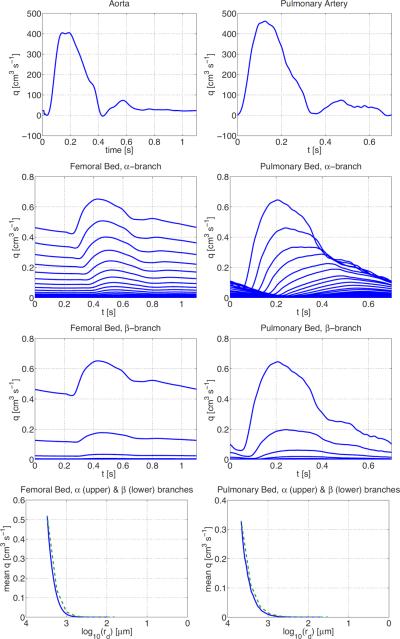
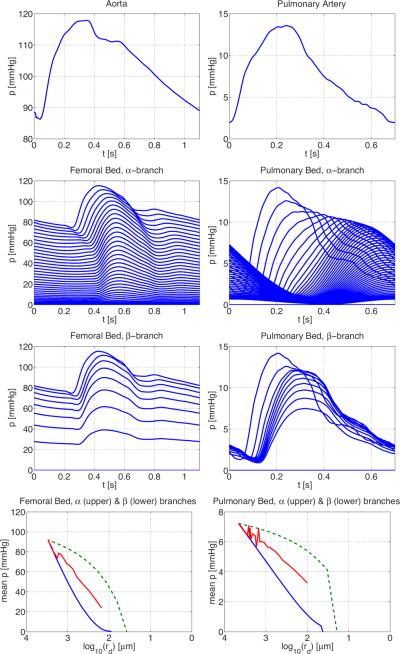
Detailed description of numerical computations, as well as results showing pressure and flow in numerous large systemic arteries can be found in Olufsen et al. (2000). In Figures 6 and 7 we show examples of the flow and pressure in both the large and small systemic and pulmonary arteries. For both systems, results were converging to a periodic steady state after 3 or 4 cardiac cycles. For the systemic arteries, we show pressure and flow in the proximal ascending aorta, while flow in the microcirculation is from the vascular bed originating downstream from the femoral artery. Similar graphs are shown for the pulmonary aorta and the pulmonary vascular bed. Most of the drop in blood pressure occurs in the small blood vessels although the the precise location and nature of these resistance arteries is not well known (Christensen & Mulvaney 2001), so it is of particular interest to study how the pressure varies in the structured tree model.
Figure 6.
Flow in the systemic (left column) and pulmonary (right column) arteries. The top graphs show inflow to the systemic (left) and pulmonary (right) arteries from two different individuals. The second and third rows show flow along the α- and β-branches in the femoral (left) and pulmonary (right) vascular beds. The bottom graphs show the mean flow in these vascular beds along the α (upper, green dashed) and β (lower, blue) branches.
Figure 7.
Pressure in the systemic and pulmonary vascular beds. From top row shows the pressure in the proximal aorta, and then pressures in the femoral vascular bed from two different individuals. The top row shows the pressure in the aorta (left) and pulmonary artery (right). The second and third rows show pressure profiles along the α- and β-branches, respectively. The bottom row shows the mean pressure along the α- (upper, green dashed) and β-branch (lower, blue), together with the average across all vessels in the vascular bed (centre line, red).
The top rows in the two sets of figures show that, over one period, the flows in the aorta and pulmonary artery are similar, and that the pressure in systemic circulation is much greater than that in the pulmonary circulation. The next two rows show the flows and pressures over one period in each vessel of the vascular beds along the α- and β-branches, respectively. The top line in each case in the second row corresponds to the root vessel of radius r0 in the structured tree, the second line to the vessel of radius αr0, the third line to the vessel of radius α2r0, etc. Similarly, the top line in each case in the third row corresponds to the root vessel of radius r0 in the structured tree, the second line to the vessel of radius βr0, the third line to the vessel of radius β2r0, and so on. We clearly see the propagation of the flow and pressure pulse along successive generations, and the gradual decrease in amplitude. The final column shows mean pressures and flows as a function of vessel radius along these two branches. The mean flows depend only on the vessel radius, whereas the mean pressures are higher along the α-branches than along β-branches for vessels of the same radius. The mean pressure averaged over all vessels of a given radius in the structured tree is given by the centre line in the last columns of Figure 7. These are approximately linear, giving the following relations between the mean pressure and radius for the systemic and pulmonary vascular beds:
| (3.1) |
where psys and ppulm are the pressures in mmHg, and rsys and rpulm are the radii measured in μm in the systemic and pulmonary vascular beds, respectively. Similar log-linear scaling laws are reported in Levy et al. (2001, Figure 2), from which we estimate that p = 50 log10 r – 5 in the systemic microcirculation for 5 < r < 50 μm. This gives some confidence that the structured tree gives a good representation of a vascular bed, albeit that the radius of the terminal vessels of the femoral vascular bed is rmin = 100 μm.
Figure 2.
A tapering artery. For the model, the vessel length (L) as well as the diameter at the proximal (at x = 0) and distal (at x = L) ends of the vessel are measured. Using this information, the unstressed vessel area is calculated, where r0(x) is calculated from (2.1).
3.2. Rarefaction
Rarefaction is defined as a reduction of vessels per unit volume within the vascular bed. Structural rarefaction has been observed in both skin capillaries, and intramuscular resistance arteries in hypertension (Feihl et al. 2006). Importantly, it has also been demonstrated in borderline hypertension, and in normotensive young offspring of parents with hypertension, suggesting that microcirculatory rarefaction may be a cause of hypertension rather than the other way around. In this study, we impose rarefaction by changing parameters in the structured tree, while keeping the radius of the smallest vessels, rmin, fixed.
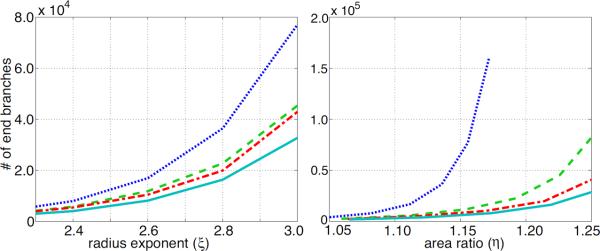
First, Figure 8 (left) shows that the area ratio, η increases with an increasing radius exponent ξ. Different lines indicate different values of the asymmetry ratio γ, and the figure shows that increasing either ξ or γ leads to an increase in η. The centre and right graphs show the effect of changing the radius exponent ξ and the asymmetry ratio γ (and thus altering the area ratio η) on the total number of vessels in a structured tree modelled vascular bed. The results show that the vascular bed becomes rarefied (i.e. the total number, and thus density, of vessels is reduced) when the area ratio η or the radius exponent ξ are decreased. Figure 9 shows how many terminal vessels, the smallest calibre vessels, there are in the structured tree, and how this varies with ξ, γ and η. Again, we see that a reduced area ratio results in rarefied trees with fewer small calibre blood vessels.
Figure 8.
Relationship between radius exponent ξ and the area ratio η (left), as well as effects of rarefaction on the total number of vessels in the structured tree as a function of the radius exponent (centre), and the area ratio (right). The graphs are for four values of γ = {0.25, 0.5, 0.75, 1.0} shown as dotted, dashed, dash-dotted, and solid curves, respectively.
Figure 9.
Effects of rarefaction on the number of end vessels in a structured tree. The graphs are for four values of γ = {0.25, 0.5, 0.75, 1.0} coloured blue (dotted), green (dashed), red (dash–dotted), and cyan (solid), respectively.
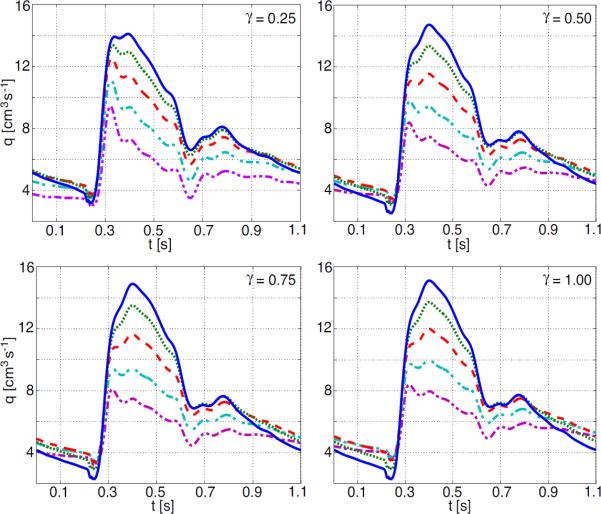
The impact of rarefaction on pressure and flow are shown in Figures 10 and 11 and summarized in Table 2. Results for various degrees of rarefaction were generated for the proximal aorta (5 cm above the aortic valve), the femoral artery (2 cm from the end of the artery), and the main pulmonary artery. The effects on pressure, are illustrated in Figure 11. For the proximal arteries, increased rarefaction (predicted via a decreased radius exponent ξ) leads to an increase in mean pressure (the increase is almost linear with the decrease in ξ), and a decreased pulse pressure. The effect is more pronounced in the main pulmonary artery (shown in Figure 11) than in the proximal aorta (compare values given in Table 2. Interestingly, it should be noted that in the femoral artery, the mean pressure is increased (similar to the other vessels), while the pulse pressure increases to a plateau of around 33 mmHg as the vascular bed becomes more rarified.
Figure 10.
Effects of rarefaction on flow waveforms in the femoral artery. Lines on each graph correspond to ξ = {2.2, 2.4, 2.6, 2.8, 3.0} indicated by blue (solid), green (dot), red (dash), cyan (dash-dot) and magenta (dash-dot-dot) respectively.
Figure 11.
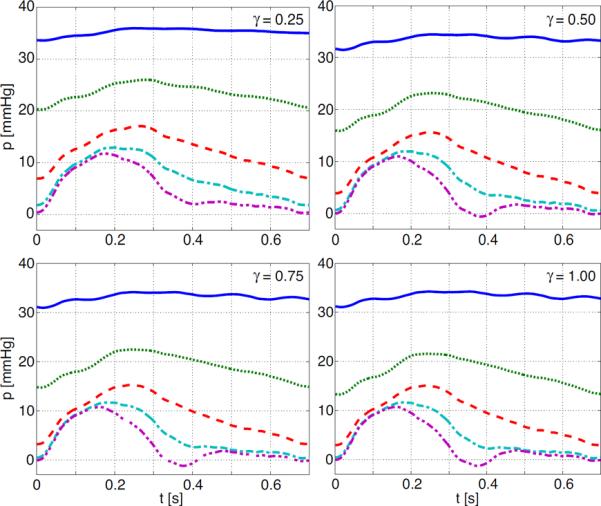
Effects of rarefaction on pressure waveforms in the main pulmonary artery. Lines on each graph correspond to ξ = {2.2, 2.4, 2.6, 2.8, 3.0} indicated by blue (solid), green (dot), red (dash), cyan (dash-dot) and magenta (dash-dot-dot) respectively.
Table 2.
The impact of rarefaction on mean and pulse pressure. Results are given for the proximal aorta (PA), the femoral artery (FA), and the main pulmonary artery (PuA). As an indicator of increased rarefaction we use the radius exponent ξ, a smaller value of ξ represents more rarefied trees.
| Vessel | mean pressure (mmHg) | pulse pressure (mmHg) |
|---|---|---|
| PA (ξ = 3.0) | 90 | 36.0 |
| PA (ξ = 2.6) | 108 | 31.5 |
| PA (ξ = 2.2) | 130 | 26.5 |
|
| ||
| FA (ξ = 3.0) | 77 | 34.0 |
| FA (ξ = 2.6) | 95 | 42.0 |
| FA (ξ = 2.2) | 120 | 43.8 |
|
| ||
| PuA (ξ = 3.0) | 5 | 12 |
| PuA (ξ = 2.6) | 10 | 12 |
| PuA (ξ = 2.2) | 33 | 3 |
Note that for the femoral artery pulse pressure is increasing with increased rarefaction, while for the proximal and pulmonary artery pulse pressure goes down with increased rarefaction.
There is almost no change in neither mean or the pulse flow in the proximal vessels, which is to be expected since the inflow is specified into these vessels (Vaughan 2010). The most significant change is in the flow in the more distal arteries, such as the femoral artery (see Figure 10). In these vessels, rarefaction brings an increase in peak flow rate, smoothing of the overall wave profile, and dominance of the second, reflected peak.
3.3. Arterial compliance
In addition to studying impact on changing properties in the structured tree, we also show results of changing arterial compliance. In our previous studies, arterial compliance was controlled by estimates of Young's modulus E, vessel wall thickness h, and undis-tended radius r0, in the parameter Eh/r0. By increasing (or decreasing) the value of this parameter, we can model the effects of decreased (or increased) arterial compliance. This parameter appears both in the large vessels and in the structured tree, representing vessels in the vascular bed. Studies of compliance changes in the small arteries of the vascular bed alone show little effect on peak and mean pressures. The only effect that can be noted is a slightly earlier and higher peaking of the flow wave which is illustrated in Figure 12 for the radial artery, this effect was to subtle to be observed in either the proximal aorta or the femoral artery (the latter graphs are not shown). The percentage value noted on the graphs refers to the percentage change in the compliance parameter Eh/r0.
Figure 12.
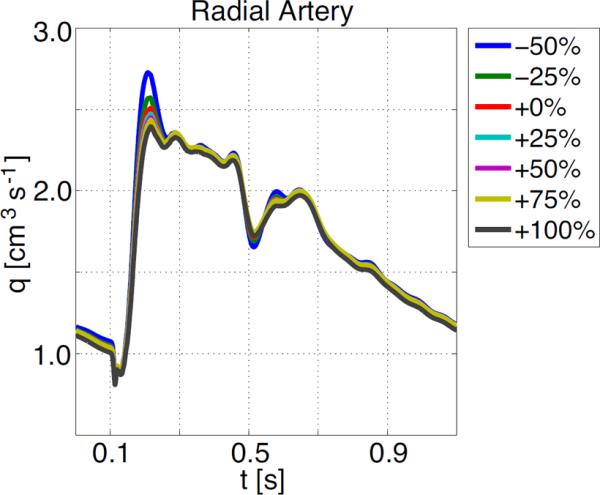
Effects of changing compliance in the small vessels on flow in the radial artery.
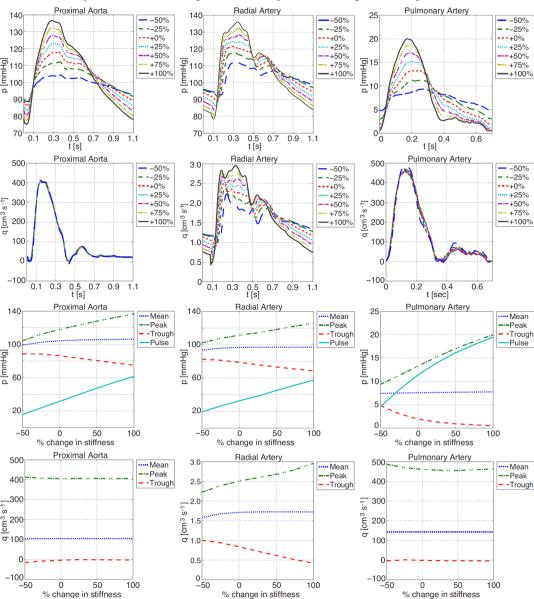
On the other hand, Figure 13 shows that the peak and pulse pressures increase significantly with decreasing arterial compliance in the large arteries. Moreover, both the flow and pressure profiles of the more distal vessels (such as the radial artery shown here) show earlier peaking of the incident and reflected components of the waveforms (the first and second peaks respectively). This effect is a result of the fact that stiffer vessels display an increased wave propagation speed. Almost identical results are seen in response to uniform compliance changes in both the large and small arteries.
Figure 13.
Effects of decreasing compliance in the large vessels (decreasing compliance makes the vessels stiffer) on pressure and flow in the proximal aorta, the radial and the main pulmonary arteries.
4. Discussion
The systemic arteries model originally developed by Olufsen (1999) has been extended to model the dynamics of the pulmonary arteries. We have derived new scaling laws (2.12) for the length to radius ratios of small pulmonary vessels from published data. The results show that we can get good estimates for the geometric and material properties of these vessels, resulting in realistic simulations of the the flow and pressure profiles based on MRI data that we acquired. In addition, we have for the first time presented results on the pressure drop in structured tree models of both systemic and pulmonary vascular beds. Even though the terminal vessels in our scheme are relatively large, with radii rmin equal to 100 μm for the systemic vascular beds and 50 μm for the pulmonary beds, we find a log-linear scaling between pressure and radius, similar to that found in experiments.
4.1. Microvascular rarefaction
We defined rarefaction as the `reduction of vessels per unit volume within the vascular bed' implemented via a reduction of area ratio η of the structured tree. Figure 8 shows that this method of modelling rarefaction decreases the total number of vessels in the structured tree, and so has desired effect of reducing the overall density of vessels in the vascular bed. Another feature of rarefaction is anatomical absence of the smallest calibre of blood vessels. Figure 9 shows again how our modelling of rarefaction simulates this absence of small vessels by vastly reducing the number of terminal vessels in the structured tree.
Rarefaction has a great impact on pulmonary artery pressure, while in the systemic arteries, the impact is less pronounced. This can be seen from Table 2 as well as figures Figures 10 and 11, which show the impact on flow and pressure in the systemic and pulmonary arteries. The effects of rarefaction of small vessels, are that the simulated pressure waveforms in the large arteries are of higher peak and mean values, but lower pulsatility compared to values found using normal and more densely packed vascular beds. This agrees with the hypothesis that microcirculatory rarefaction in smaller, distal arteries may indeed be the cause of hypertension in the large proximal arteries (Antonios et al. 2003; Noon et al. 1997). Furthermore, the decrease in pulse-pressure agrees with results observed in patients su ering from pulmonary hypertension and hypoxic lung disease (Tuder et al. 2007).
Moreover, computational results show that there are significant changes in pressure profile between proximal and distal arteries which may be useful in future clinical diagnosis.
4.2. Arterial compliance
The similarity of the effects seen by changing large vessel compliance only, and by uniformly changing both large and small vessel compliance, suggest that the effects of stiffening the large vessels far outweigh the effects of stiffening of the small vessels. This agrees with the findings of Azer & Peskin (2007), who performed a similar brief investigation on a different implementation of the same base model. Furthermore, our results support Azer and Peskin's conclusion that stiffening of the large arteries results in pressure increases consistent with observations of isolated systolic hypertension, as occurs in ageing (Franklin 2004; Griffith et al. 2005; Nichols 2005).
4.3. Cardiac output versus vessel remodeling
In our study, cardiac output was fixed (it was input to the model, via specified inflow boundary conditions). The advantage of fixing cardiac output, is that our model reflects effects on the flow and pressure pulse due to rarefaction or changes in vascular compliance isolated from the effects of remodelling of the heart, which inevitably occur as disease progresses. In the current model, changes in cardiac output can only be accounted for by directly changing the specified inflow waveforms. Thus we may be able to deduct how changes in cardiac output impacts flow and pressure in the network, but we will not be able to investigate how microvascular rarefaction may impact properties in the heart. Clinical observations on both healthy subjects and those with pulmonary hypertension by Syyed et al. (2008) show that in all cases there are linear relationships between the systolic pulmonary artery pressure (pS), diastolic pulmonary artery pressure (pD), and mean pulmonary artery pressure (), specifically in mmHg
These relations were obtained using a least-squares method with R2 values of 0.98, and 0.97, respectively. From this, the pulse pressure can be computed as
The results outlined in Table 2 for the femoral artery show a similar positive correlation between pulse pressure and mean pressure, while those for the more-proximal aorta and pulmonary artery have a negative correlation. This indicates that changes in cardiac output also play a crucial role in the control of the pressure pulse in the largest arteries, highlighting the need for models of the circulation that combine the fluid- structure dynamics of the heart with realistic models of the vasculature, such as the model described here.
5. Conclusion
In conclusion our study has shown that it is possible to predict realistic flow and pressure in both systemic and pulmonary arterial networks including small and large vessels. Moreover, we showed that the model can predict effects of rarefaction by changing the geometry of the microvascular network, and that effects of changed vascular compliance can be studied by changing a model parameter that appears in both the large and small vessels.
Simulations with this model confirm two major hypotheses: (i) microcirculatory rarefaction in smaller, distal arteries may indeed be the cause of hypertension in the large proximal arteries, and (ii) stiffening of the large arteries results in pressure increases consistent with observations of isolated systolic hypertension, as occurs in ageing. Future work, coupling the multiscale model developed here to a heart model has to be done, to relate impacts of vessel stiffening and microvascular rarefaction to remodelling of the heart.
Acknowledgements
Olufsen was funded in part by the National Science Foundation, grants #1122424, and by NIH under award NIH-NIGMS under 1P50-GM094503-01A1. Vaughan was funded by a studentship from the UK EPSRC. The CMR data acquisition and analysis was performed by Lindsey McLure at the Western Infirmary, Glasgow.
REFERENCES
- Antonios TF, Singer DRJ, Markandu ND, Mortimer PS, MacGregor GA. Rarefaction of skin capillaries in borderline essential hypertension suggests an early structural abnormality. Hypertension. 1999;34:655–658. doi: 10.1161/01.hyp.34.4.655. [DOI] [PubMed] [Google Scholar]
- Antonios TF, Rattrat FM, Singer DRJ, Markandu ND, Mortimer PS, MacGregor GA. Rarefaction of skin capillaries in normotensive offspring of individuals with essential hypertension. Heart J. 2003;89:175–178. doi: 10.1136/heart.89.2.175. [DOI] [PMC free article] [PubMed] [Google Scholar]
- Antonios TF. Microvascular rarefaction in hypertension — reversal or over-correction by treatment? Am. J. Hyperten. 2006;19:484–485. doi: 10.1016/j.amjhyper.2005.11.010. [DOI] [PubMed] [Google Scholar]
- Atabek HB, Lew HS. Wave propagation through a viscous incompressible fluid contained in an initially stressed elastic tube. Biophys. J. 1966;6:481–503. doi: 10.1016/S0006-3495(66)86671-7. [DOI] [PMC free article] [PubMed] [Google Scholar]
- Atabek HB. Wave propagation through a viscous fluid contained in a tethered, initially stressed, orthotropic elastic tube. Biophys. J. 1968;8:626–649. doi: 10.1016/s0006-3495(68)86512-9. [DOI] [PMC free article] [PubMed] [Google Scholar]
- Azer K, Peskin CS. A one-dimensional model of blood flow in arteries with friction and convection based on the Womersley velocity profile. Cardiovasc. Eng. 2007;7:51–73. doi: 10.1007/s10558-007-9031-y. [DOI] [PubMed] [Google Scholar]
- Caro C, Pedley T, Schroter R, Seed W. The mechanics of the circulation. Oxford University Press; Oxford, UK: 1978. [Google Scholar]
- Christensen KL, Mulvany MJ. Location of resistance arteries. J. Vasc. Res. 2001;38:1–12. doi: 10.1159/000051024. [DOI] [PubMed] [Google Scholar]
- Feihl F, Liaudet L, Waeber B, Levy BI. Hypertension: a disease of the microcirculation? Hypertension. 2006;48:1012–1017. doi: 10.1161/01.HYP.0000249510.20326.72. [DOI] [PubMed] [Google Scholar]
- Franklin S. Systolic blood pressure. Am. J. Hypertens. 2004;17:49S–54S. doi: 10.1016/j.amjhyper.2004.08.020. [DOI] [PubMed] [Google Scholar]
- Fung YC. Biomechanics: Circulation. Springer; New York, NY: 1996. [Google Scholar]
- Greene AS, Tonellato PJ, Lui J, Lombard JH, Cowley AW. Microvascular rarefaction and tissue vascular resistance in hypertension. Am. J. Physiol. 1989;256:126–131. doi: 10.1152/ajpheart.1989.256.1.H126. [DOI] [PubMed] [Google Scholar]
- Griffith T, Klassen P, Franklin S. Systolic hypertension: an overview. Am. Heart J. 2005;149:769–775. doi: 10.1016/j.ahj.2005.01.037. [DOI] [PubMed] [Google Scholar]
- Hopkins N, McLoughlin P. The structural basis of pulmonary hypertension in chronic lung disease: remodelling, rarefaction or angionesis? J.Anat. 2002;201:335–348. doi: 10.1046/j.1469-7580.2002.00096.x. [DOI] [PMC free article] [PubMed] [Google Scholar]
- Huang W, Yen RT, McLaurine M, Bledsoe G. Morphometry of the human pulmonary vasculature. J. Appl. Physiol. 1996;81:2123–2133. doi: 10.1152/jappl.1996.81.5.2123. [DOI] [PubMed] [Google Scholar]
- Hudetz AG. Percolation phenomenon: the effect of capillary network rarefaction. Microvasc. Res. 1993;45:1–10. doi: 10.1006/mvre.1993.1001. [DOI] [PubMed] [Google Scholar]
- Iberall A. Anatomy and steady flow characteristics of the arterial system with an introduction to its pulsatile characteristics. Math. Biosci. 1967;1:375–385. [PubMed] [Google Scholar]
- Krenz GS, Dawson CA. Flow and pressure distributions in vascular networks consisting of distensible vessels. Am. J. Physiol. 2003;284:H2192–H2203. doi: 10.1152/ajpheart.00762.2002. [DOI] [PubMed] [Google Scholar]
- Levy BI, Ambrosio G, Pries AR, Struijker-Boudier HA. Microcirculation in hypertension: a new target for treatment? Circulation. 2001:735–740. doi: 10.1161/hc3101.091158. [DOI] [PubMed] [Google Scholar]
- Nichols WW. Clinical measurement of arterial stiffness obtained from noninvasive pressure waveforms. Am. J. Hypertens. 2005;18:3S–10S. doi: 10.1016/j.amjhyper.2004.10.009. [DOI] [PubMed] [Google Scholar]
- le Noble JL, Tangelder GJ, Slaaf DW, van Essen H, Reneman RS, Struyker-Boudier HA. A functional morphometric study of the cremaster muscle microcirculation in young spontaneously hypertensive rats. J. Hypertens. 1990;8:741–748. doi: 10.1097/00004872-199008000-00008. [DOI] [PubMed] [Google Scholar]
- Noon JP, Walker BR, Webb DJ, Shore AC, Holton DW, Edwards HV, Watt GC. Impaired microvascular dilatation and capillary rarefaction in young adults with a predisposition to high blood pressure. J. Clin. Invest. 1997;99:1873–1879. doi: 10.1172/JCI119354. [DOI] [PMC free article] [PubMed] [Google Scholar]
- Olufsen MS. PhD Thesis. Department of Mathematics, Roskilde University; Denmark: 1998. Modeling the Arterial System with Reference to an Anesthesia Simulator. [Google Scholar]
- Olufsen MS. Structured tree outflow condition for blood flow in larger systemic arteries. Am. J. Physiol. Heart Circ. Physiol. 1999;276:H257–H268. doi: 10.1152/ajpheart.1999.276.1.H257. [DOI] [PubMed] [Google Scholar]
- Olufsen MS, Peskin CS, Kim WY, Pedersen EM, Nadim A. Numerical simulation and experimental validation of blood flow in arteries with structured-tree outflow conditions. Ann. Biomed. Eng. 2000;28:1281–1299. doi: 10.1114/1.1326031. [DOI] [PubMed] [Google Scholar]
- Ottesen JT, Olufsen MS, Larsen JK. Applied Mathematical Models in Human Physiology. SIAM; Philadelphia, PA: 2003. [Google Scholar]
- Peacock AJ, Rubin LJ. Pulmonary circulation: diseases and their treatment. 2nd edition Hodder Arnold Publication; London, UK: 2004. [Google Scholar]
- Pedley TJ. The Fluid Mechanics of Large Blood Vessels. Cambridge University Press; Cambridge, UK: 1980. [Google Scholar]
- Popel AS, Johnson PC. Microcirculation and Hemorheology. Annu. Rev. Fluid Mech. 2005;37:43–69. doi: 10.1146/annurev.fluid.37.042604.133933. [DOI] [PMC free article] [PubMed] [Google Scholar]
- Pries AR, Secomb TW, Gaehtgens P. Design principles of vascular beds. Circ. Res. 1995;77:1017–1023. doi: 10.1161/01.res.77.5.1017. [DOI] [PubMed] [Google Scholar]
- Roy AG, Woldenberg MJ. A generalization of the optimal models of arterial branching. Bull. Math. Biol. 1982;44:349–360. doi: 10.1007/BF02462285. [DOI] [PubMed] [Google Scholar]
- Simonneau G, Galie N, Rubin LJ, Langleben D, Seeger W, Domenighetti G, Gibbs S, Lebrec D, Speich R, Beghetti M, Rich S, Fishman A. Clinical classification of pulmonary hypertension. J. Am. Coll. Cardiol. 2004;43:5–12. doi: 10.1016/j.jacc.2004.02.037. [DOI] [PubMed] [Google Scholar]
- Singhal S, Henderson R, Horsfield K, Harding K, Cumming G. Morphometry of the Human Pulmonary Arterial Tree. Circ. Res. 1973;33:190–197. doi: 10.1161/01.res.33.2.190. [DOI] [PubMed] [Google Scholar]
- Steele BN, Olufsen MS, Taylor CA. Fractal network model for simulating abdominal and lower extremity blood flow during resting and exercise conditions. Comp. Meth. Biomech. Biomed. Eng. 2007;10:39–51. doi: 10.1080/10255840601068638. [DOI] [PubMed] [Google Scholar]
- Syyed R, Reeves JT, Welsh D, Raeside D, Johnson MK, Peacock AJ. The Relationship Between the Components of Pulmonary Artery Pressure Remains Constant Under All Conditions in Both Health and Disease. Chest. 2008;133:633–639. doi: 10.1378/chest.07-1367. DOI 10.1378/chest.07-1367. [DOI] [PubMed] [Google Scholar]
- Tuder RM, Yun JH, Bhunia A, Fijalkowska I. Hypoxia and chronic lung disease. J. Mol. Med. 2007;85:1317–1324. doi: 10.1007/s00109-007-0280-4. [DOI] [PubMed] [Google Scholar]
- Vaughan GDA. PhD Thesis. Faculty of Information and Mathematical Sciences, University of Glasgow; UK: 2010. Pulse propagation in the pulmonary and systemic arteries. [Google Scholar]


