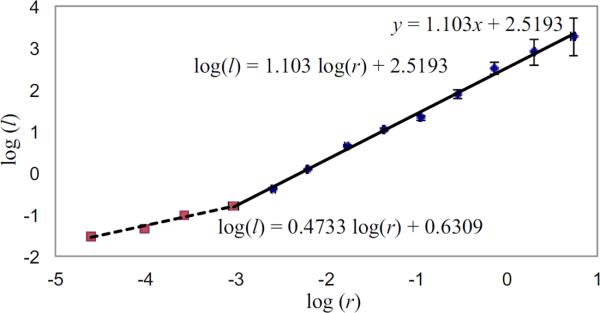
Figure 5.
Log-log plots of the vessel radius (r in mm) versus length (l in mm) for pulmonary arteries, using data from Huang et al. (1996). The two lines are fitted using the method of least squares, and show that different scalings apply for r < 0.05 mm (Strahler orders 1 to 4) and r > 0.05 mm (Strahler orders 4 to 12).

