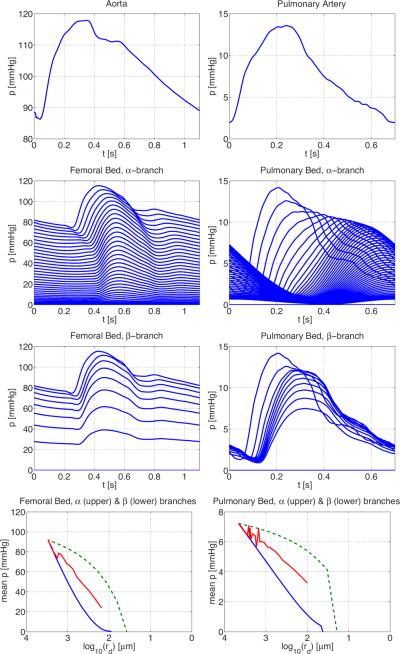
Figure 7.
Pressure in the systemic and pulmonary vascular beds. From top row shows the pressure in the proximal aorta, and then pressures in the femoral vascular bed from two different individuals. The top row shows the pressure in the aorta (left) and pulmonary artery (right). The second and third rows show pressure profiles along the α- and β-branches, respectively. The bottom row shows the mean pressure along the α- (upper, green dashed) and β-branch (lower, blue), together with the average across all vessels in the vascular bed (centre line, red).

