
Figure 2.
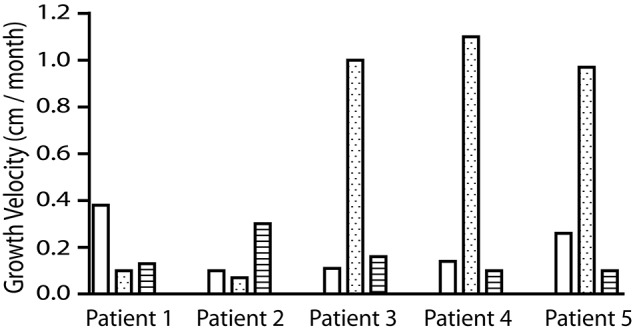
Clinical outcome of children with OI after bone marrow MNC infusion. The mean growth velocity (centimeters per month) of patients is shown during the 6 months before MNC infusion (□), the first 3-month interval ( ), and the second 3-month interval (▤) after MNC infusion.