
Figure 2.
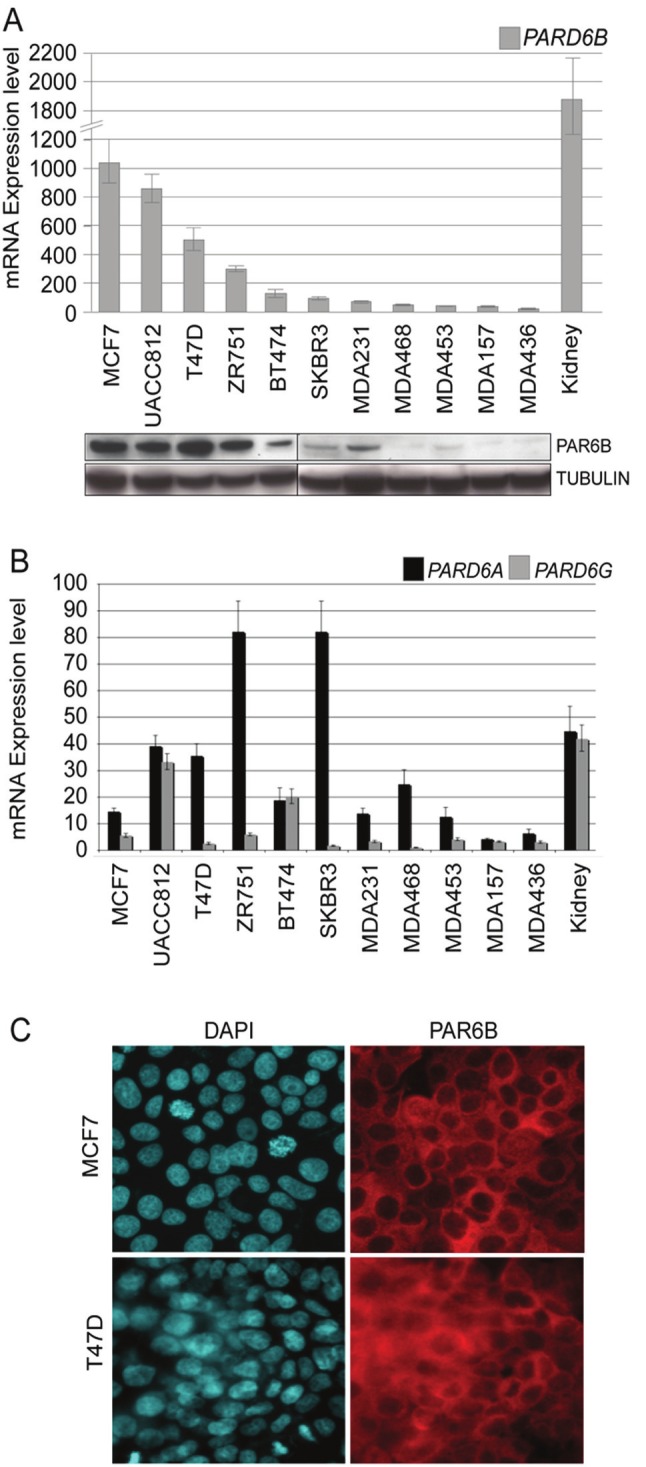
Survey of endogenous PARD6B expression in breast cancer cell lines. A. Quantitative-RT-PCR analysis was performed on 11 breast cancer cell lines for PARD6B. Human adult kidney total RNA was used as a positive control. PAR6B protein level was determined by western blot from breast cancer cell line whole cell lysates. Blots were re-probed with anti -tubulin to control for protein loading. B. Q-RTPCR for PARD6A and PARD6G. The level of expression is comparable with PARD6B in Figure 2A, as data shown in both graphs has been normalized to the level of PARD6G expression. C. IF staining of endogenous PAR6B protein in MCF7 and T47D (polyclonal antibody isolated in this study).