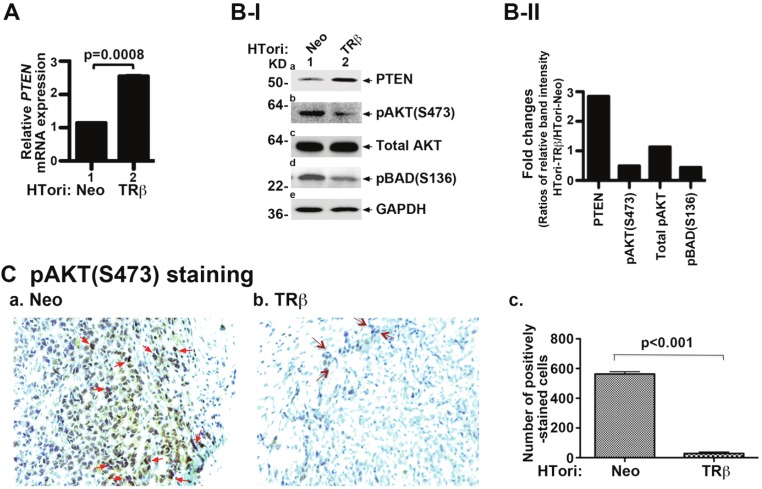
Figure 6.
Reactivation of p53 to attenuate AKT signaling by physical interaction of TRβ with SV40Tag. (A). Activation of the expression of the p53 downstream target PTEN gene. Total RNA of HTori-Neo and HTori-TRβ was prepared and mRNA expression was determined, as described in Materials and Methods. Data are the mean ± SEM (duplicate experiments). The increases in the expression of PTEN mRNA are significant with p values as shown. Data are the mean ± SEM (duplicate experiments). (B-I) Decreased activities of AKT signaling in HTori-TRβ cells. Cell extracts of HTori-Neo and HTori-TRβ cells were prepared, followed by Western blot analyses (20 μg cell lysates were used) for PTEN (panel a), pAKT (S473) (panel b), total AKT (panel c), pBAD(S136) (panel d), and the loading control GAPDH (panel e). Increased PTEN expression (panel a) led to attenuation of AKT signaling by decreased phosphorylation of AKT (panel b) and BAD (panel d). (B-II). Fold of changes of protein abundance of key regulators. The band intensities shown in B-I was quantified and compared as ratios of band intensity of each protein in HTori-TRβ to that of HTori-Neo cells. Each protein level was normalized to GAPDH. (C). pAKT (S473) staining of tumor cells derived from HTori-Neo cells (panel a) and cells derived from HTori-TRβ (panel b). Arrows point to the positive nuclear staining of pAKT (S473). The positively pAKT(S473) stained cells were counted and graphed (panel c). The difference in the number of positively stained cells between tumors cells and cells derived from the HTori-TRβ cell-induced growth is highly significant (p<0.001).

