Figure 4.

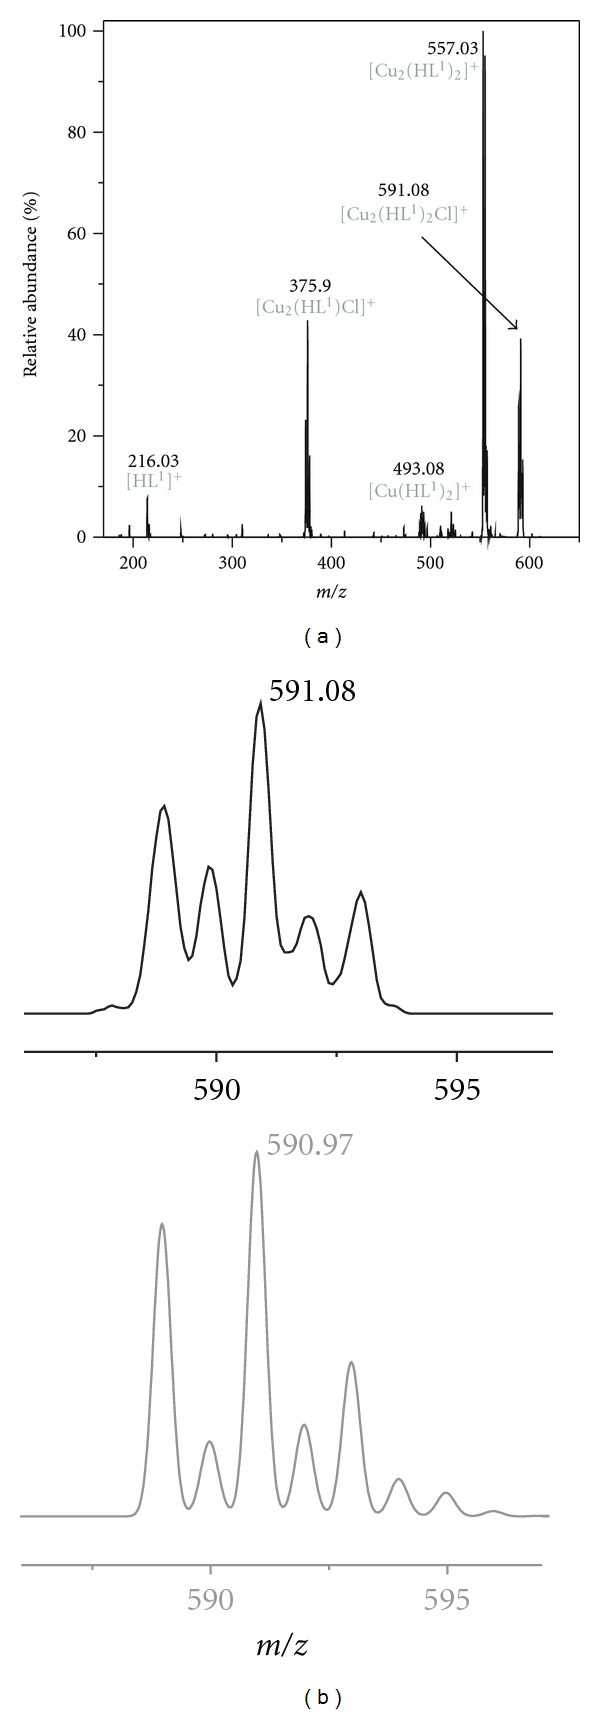
The MS2 spectrum showing the fragmentation of the peak 591 m/z, the [Cu2(HL1)2Cl]+ fragment of 1 (left); the comparison of the measured (up) and calculated (down, in grey) isotope pattern of 591 m/z.

The MS2 spectrum showing the fragmentation of the peak 591 m/z, the [Cu2(HL1)2Cl]+ fragment of 1 (left); the comparison of the measured (up) and calculated (down, in grey) isotope pattern of 591 m/z.