
Figure 6.
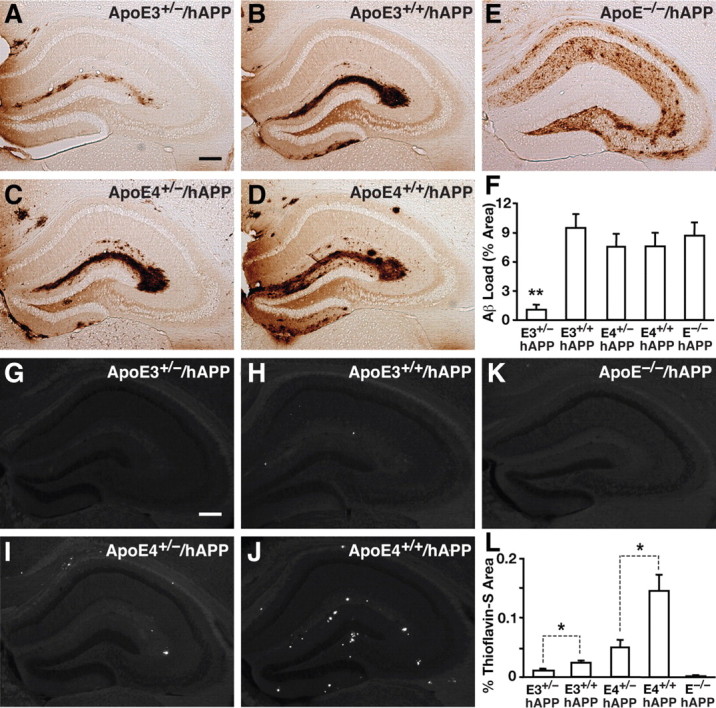
Halving the levels of apoE significantly attenuates Aβ deposition in aged mice. A–E, Representative sections from 12-month-old aged E3+/−/hAPP (A), E3+/+/hAPP (B), E4+/−/hAPP (C), E4+/+/hAPP (D), and E−/−/APP (E) mice immunostained for Aβ. F, Quantification of Aβ immunostain by densitometry for the percentage area of Aβ deposition in the five genotypes of mice. G–K, Representative sections from 12-month-old E3+/−/hAPP (G), E3+/+/hAPP (H), E4+/−/hAPP (I), E4+/+/hAPP (J), and E−/−/hAPP (K) mice stained with thioflavin S dye to fluorescently label fibrillar/amyloid plaques. L, Quantification of percentage area positive for thioflavin S by densitometry. Values are mean ± SEM. N = 6–13 mice per genotype, three sections per mouse. *p < 0.05, by two-tailed, unpaired t test; **p < 0.01 versus all other groups by one-way ANOVA with Bonferroni's post hoc test. Scale bars, 250 μm.