FIGURE 4.

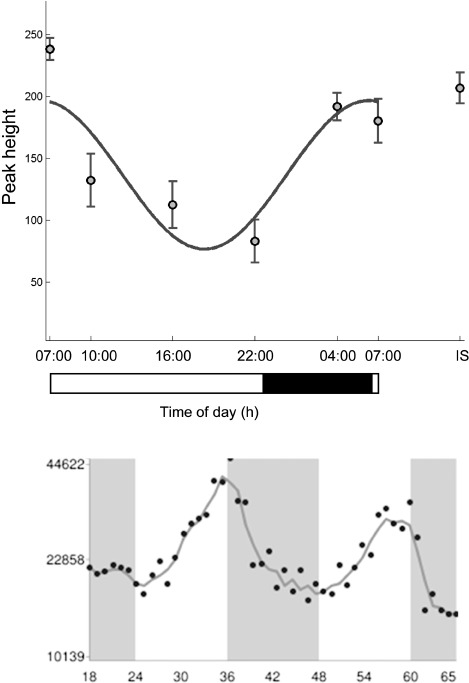
(Top panel) The temporal profile of palmitoylcarnitine in human plasma. (Bottom panel) CPT1a gene expression in a mouse model from an independent study (Hughes et al., 2009). Black/gray bars indicate lights-off and the white bar lights-on.

(Top panel) The temporal profile of palmitoylcarnitine in human plasma. (Bottom panel) CPT1a gene expression in a mouse model from an independent study (Hughes et al., 2009). Black/gray bars indicate lights-off and the white bar lights-on.