
FIGURE 4.
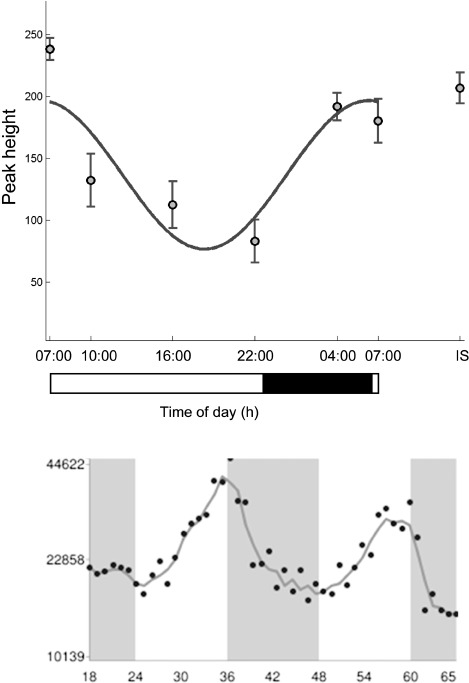
(Top panel) The temporal profile of palmitoylcarnitine in human plasma. (Bottom panel) CPT1a gene expression in a mouse model from an independent study (Hughes et al., 2009). Black/gray bars indicate lights-off and the white bar lights-on.
Official websites use .gov
A
.gov website belongs to an official
government organization in the United States.
Secure .gov websites use HTTPS
A lock (
) or https:// means you've safely
connected to the .gov website. Share sensitive
information only on official, secure websites.
(Top panel) The temporal profile of palmitoylcarnitine in human plasma. (Bottom panel) CPT1a gene expression in a mouse model from an independent study (Hughes et al., 2009). Black/gray bars indicate lights-off and the white bar lights-on.