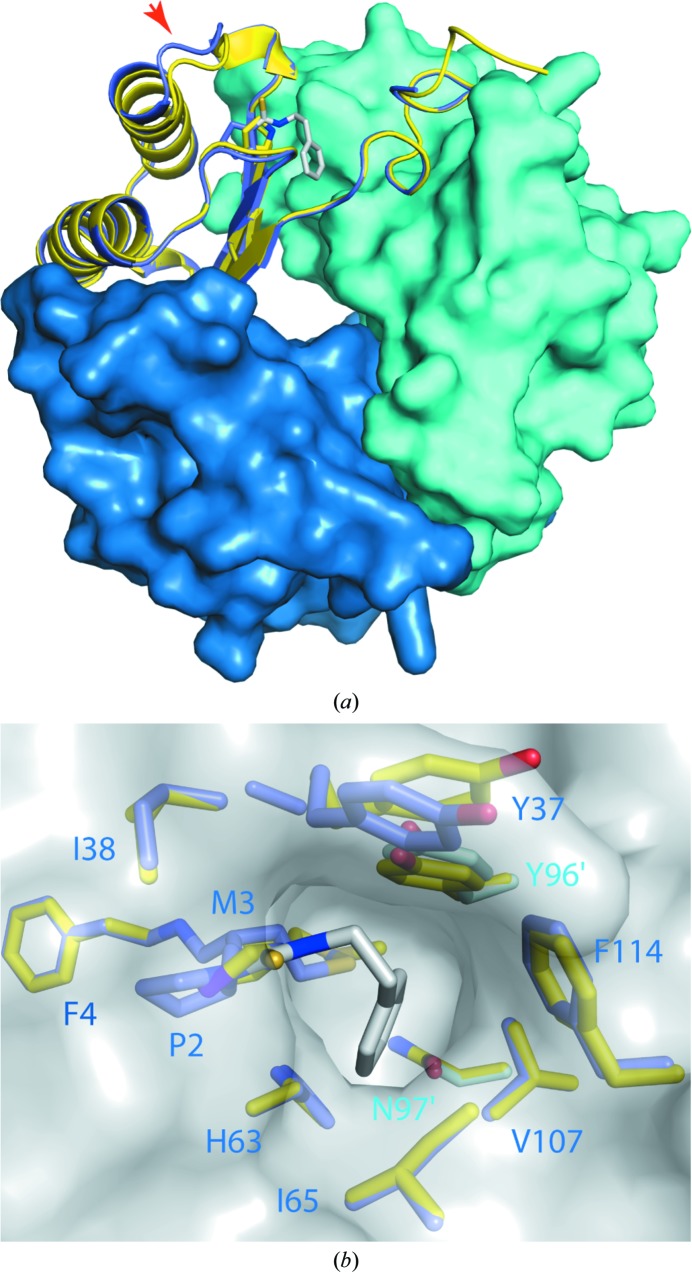
Figure 3.
Structural comparison of PEITC–MIF with MIF. The structure of PEITC–MIF (shades of blue; PDB entry 4f2k) is shown superimposed on that of unmodified MIF (yellow; PDB entry 3l5v; McLean et al., 2010 ▶). Separate chains of PEITC–MIF are coloured in different shades of blue; PEITC is shown as sticks with C atoms in white, N atoms in blue and S atoms in yellow. (a) displays the entire trimer, looking approximately down the threefold axis. Two chains are shown as surfaces, with one shown as a cartoon with the PEITC adduct and Pro2 as sticks. The red arrow indicates loop 31–34. (b) shows a view into the binding pocket. The trimer is depicted by a grey surface; residues lining the binding pocket are identified and shown as sticks with non-C atoms coloured as for PEITC.

